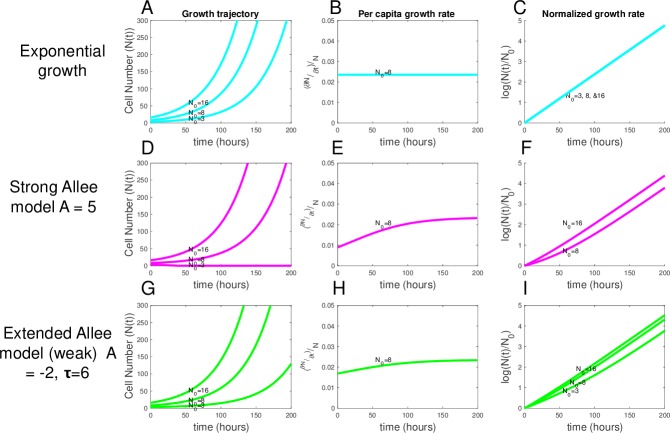
Fig 1. Average behavior of exponential, strong, and weak Allee models for different initial conditions.
(A, D, and G) Deterministic growth curves of the exponential growth model (blue), the strong Allee model (pink), and the weak Allee model (green), respectively, shown for N0 = 3, 8, and 16 for all models. (B, E, and H) Per capita growth rates demonstrate that growth rate increases in time with cell number for both Allee models. (C, F, and I) For normalized cell numbers, a clear difference is observed in the slopes depending on the initial cell number for both Allee models. Data and code used to generate this figure can be found at https://github.com/brocklab/Johnson-AlleeGrowthModel.git.

