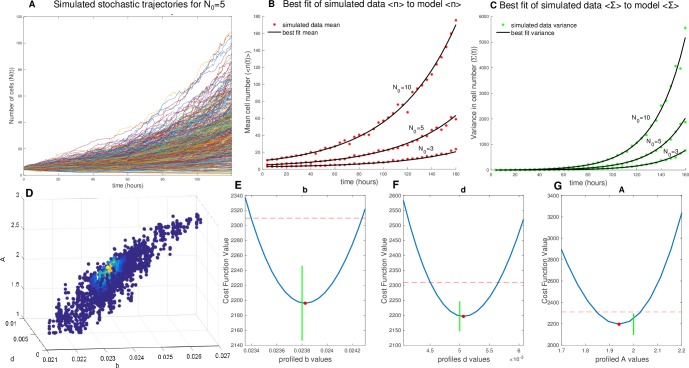
Fig 5. Fit to mean and variance from simulated stochastic data set.
(A) Example of stochastic growth model output from 5,000 simulated cell-number trajectories with initial condition of N0 = 5 and a birth rate of b = 0.0238, death rate of d = 0.005, and an Allee threshold A = 2, revealing the expected variability in growth dynamics apparent at low initial numbers. (B) From the simulated stochastic trajectories, we sample time uniformly and measure the mean cell number at each time point for N0 = 3, 5, and 10. (C) Again from the simulated stochastic trajectories, we sample time uniformly and measure the variance in cell number at each time point for N0 = 3, 5, and 10 (D) Display of parameter space searched, with parameter sets of b, d, and A colored by likelihood, indicating the framework converges on the true parameters. (E) Profile likelihood analysis of birth rate parameter estimate (red dot) of b = 0.0238 [0.02340–0.02425] with true b = 0.0238 (green line). (F) Profile likelihood analysis of death rate parameter estimate (red dot) d = 0.0051 [0.00461–0.00563] with true d = 0.005 (green line). (G) Profile likelihood analysis of Allee threshold parameter estimate (red dot) of A = 1.9393 [1.853–2.026] with true A = 2 (green line). The data and code used to generate this figure can be found at https://github.com/brocklab/Johnson-AlleeGrowthModel.git.

