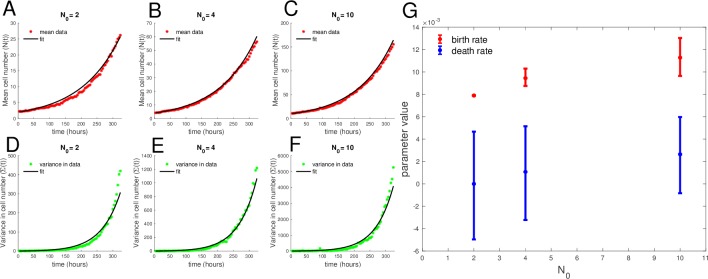
Fig 7. Best fit of each initial cell-number means and variances in time to stochastic birth–death model reveals net growth rate increases with initial cell number.
(A, B, and C) Data mean over time compared to best fit to model mean. (D, E, and F) Data variance in time compared to best fit to model variance. (G) Best fit birth and death rate parameters for the stochastic birth–death model fit to each initial condition, with confidence intervals determined from profile likelihoods. Parameter estimates for birth rates by initial cell number are b2 = 0.00793 [0.00785−0.00794], b4 = 0.00945 [0.0093−0.0096], and b10 = 0.0113 [0.0112−0.0114], and for death rates, the parameter estimates are d2 = 6.67 × 10⁻¹⁸ [−0.0005 to 0.0001], d4 = 0.0011 [0.0008−0.0013], and d10 = 0.00286 [0.0025−0.0028] for N0 = 2, 4, and 10, respectively. The data and code used to generate this figure can be found at https://github.com/brocklab/Johnson-AlleeGrowthModel.git.

