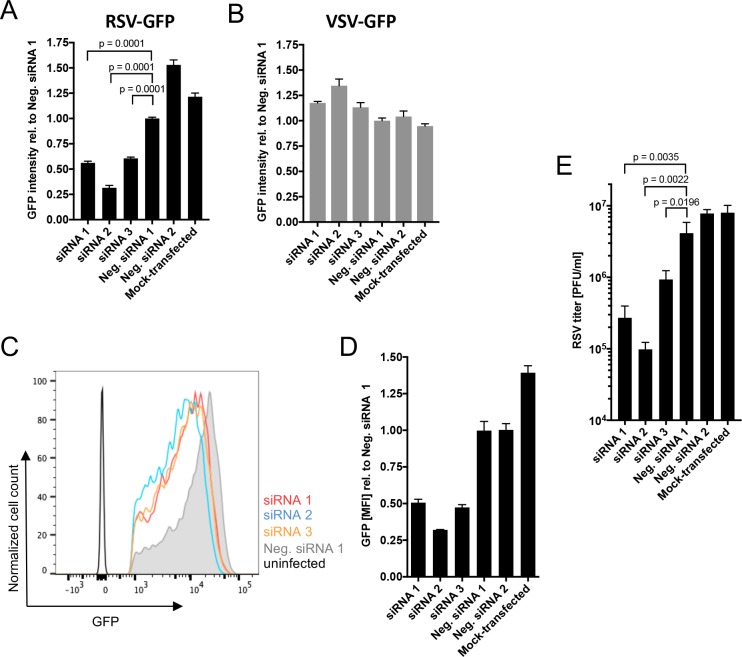
Fig 2.
Effect of ATP1A1 knockdown on infection by RSV-GFP (A, C, D) and VSV-GFP (B). A549 cells were transfected with the indicated siRNAs and 48 h later were infected with 1 PFU/cell RSV-GFP (A, C, D) or 0.5 PFU/cell VSV-GFP (B). (A and B) Effects on RSV and VSV. Following infection with RSV-GFP (A) or VSV-GFP (B), the cells were incubated for 17 h, and the GFP intensity of the total area of each well of A549 cells was quantified by scanning with an ELISA reader and is expressed relative to cells infected with the same virus for which the transfected siRNA was Neg. siRNA 1. (C and D) Flow cytometry analysis of RSV-GFP expression. Following infection with RSV-GFP, the cells were incubated for 24 h, and GFP expression of single, live, GFP+ cells was quantified by flow cytometry, with cells from an untransfected, uninfected well included for reference. The plot (C) shows cell count versus GFP intensity, and the histogram (D) shows GFP MFI relative to cells infected with the same virus for which the transfected siRNA was Neg. siRNA 1. (E) Titer of progeny RSV-GFP. Following infection with RSV-GFP (MOI = 1 PFU/cell), the cells were incubated for 24 h, and the cells and media were harvested together (Materials and Methods) and the yield of RSV-GFP was determined by plaque titration on Vero cells. All data in A-D are derived from at least three independent experiments and shown as mean values with error bars indicating the standard deviation. The statistical significance of difference was determined by one-way analysis of variance with Dunnett’s multiple comparison post-test and p-values are shown for each comparison.

