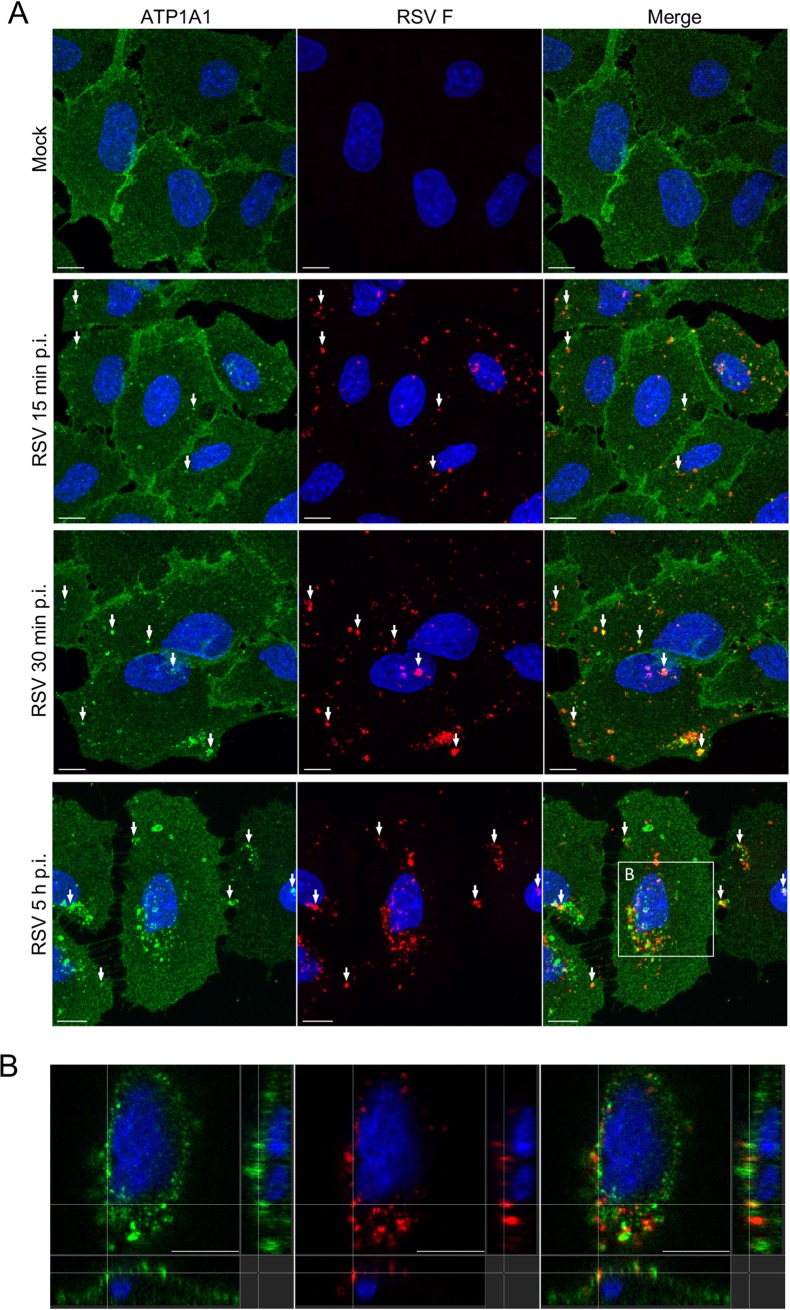
Fig 3. RSV infection triggers ATP1A1 clustering.
(A) A549 cells were inoculated with wt RSV (MOI = 5 PFU/cell). Cells were fixed at different time points p.i. with 4% PFA, permeabilized with 0.1% TritonX-100 and stained for ATP1A1 (green) with an anti-ATP1A1 MAb (ab76020) and AF488-conjugated donkey anti-rabbit secondary antibody. RSV F (red) was detected with anti-RSV F mouse MAb #1129 [72] and an AF594-conjugated anti-mouse secondary antibody. The cell nuclei were stained with DAPI (blue). Images (z-stacks) were acquired on a Leica SP5 confocal microscope, with a 63x objective (NA 1.4) and a zoom of 3.0. Arrows indicate examples of co-localization of ATP1A1 and RSV F. Scale bar 10 μm. (B) Cross section of the marked area of the RSV 5 h p.i. image of Fig 3A. The entire cross-section in ZY-view of this image is shown in S1 Movie. Scale bar 10 μm.

