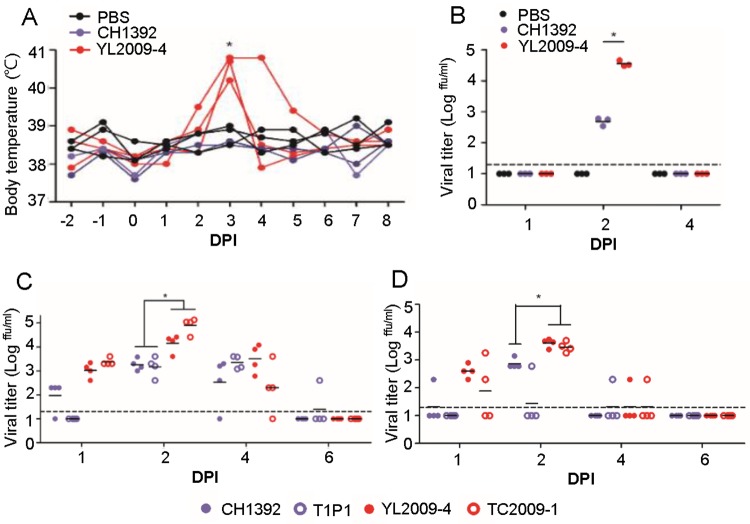
Fig 4. Comparison of viremia in experimentally-infected pigs and poultry using GI and GIII JEVs.
(A and B) Nine specific pathogen free (SPF) pigs (n = 3 per group) were subcutaneously inoculated with 105 ffu of GIII CH1392 virus ( ) or GI YL2009-4 virus (
 ), or PBS (
 ). (A) The change of each pig’s body temperature before and after viral infection is shown. (B) The viral titer in pig plasma was detected by micro-antigen focus assay at 1, 2, and 4 days post infection (DPI). (C and D) One-day old chickens (n = 4 per group) and two-day old ducklings (n = 4 per group) were subcutaneously injected with 104 ffu of GIII CH1392 (
 ), GIII T1P1 (
 ), GI YL2009-4 (
 ), and GI TC2009-1 viruses (
 ). The viral titer in plasma recovered from JEV-infected chickens (C) or ducklings (D) at 1, 2, 4, and 6 DPI (n = 4 per group) was determined by micro-antigen focus assay. The detection limit is indicated as a dotted line. (A-D) A dot plus a horizontal line represent an individual animal and a mean viral titer (C, D) of the group, respectively. The statistics comparing either two or four viruses were determined by a Student’s Two-Tailed t-test or one-way ANOVA followed by Turkey’s Multiple Comparison Test. The statistical difference was noted by an asterisk (P< 0.05).

