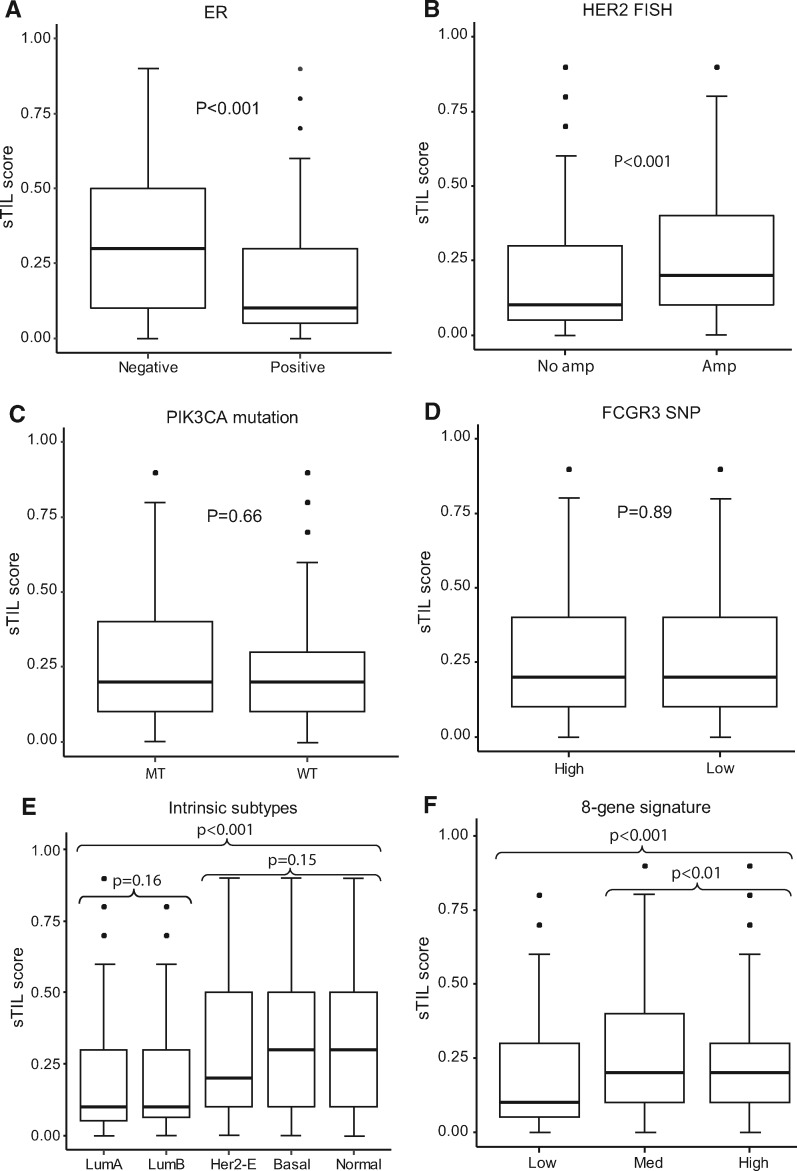
Figure 2.
Distribution of stromal tumor-infiltrating lymphocytes (sTILs) segregated by estrogen receptor status, HER2 amplification, phosphatidylinositol-4, 5-bisphosphate 3-kinase catalytic subunit alpha (PIK3CA) mutations, FCGR3A-158V/F genotyping, intrinsic subtype, and 8-gene signature groups. A) ER-negative (n = 905) vs ER-positive (n = 1024). B) HER2 human epithelial growth factor receptor 2 Fluorescence in Situ Hybridization (FISH) no amplification (n = 210) vs amplification (n = 1584). C) PIK3CA mutant (MT; n = 162) vs wild type (WT; n = 493). D) FCGR3A high-affinity (n = 726) vs low-affinity (n = 608). E) Luminal A (LumA; n = 424) vs Luminal B (LumB; n = 219) vs HER2 enriched (n = 726) vs basal (n = 98) vs normal-like (n = 74); F) 8-gene signature low (n = 178) vs medium (n = 685) vs high (n = 678) benefit group. Two-sided analysis of variance test was used to calculate P values. Error bars represent first quantile – IQR, and third quantile + IQR, where IQR is the range between first and third quantiles. FCGR3A = Fc fragment of IgG receptor IIIa; HER2-E = HER2-enriched; SNP = single nucleotide polymorphism.

