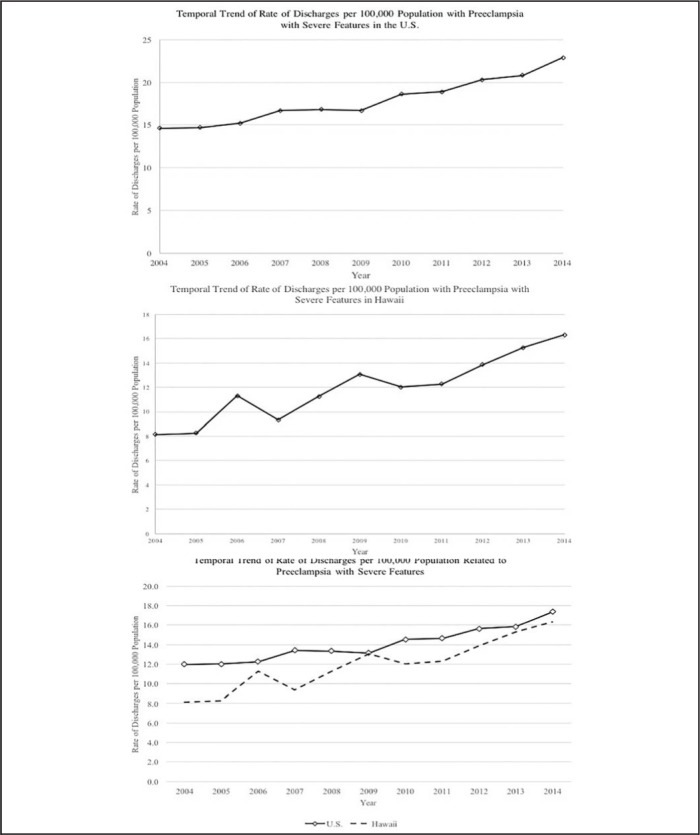
Figure 2.

11-Year Temporal Trends of Discharges Related to Preeclampsia with Severe Features in (Top) the United States and (Middle) Hawai‘i; and Temporal Trend of Rate of Discharges per 100,000 Population Related to Preeclampsia with Severe Features in the United States and Hawai‘i (bottom).
