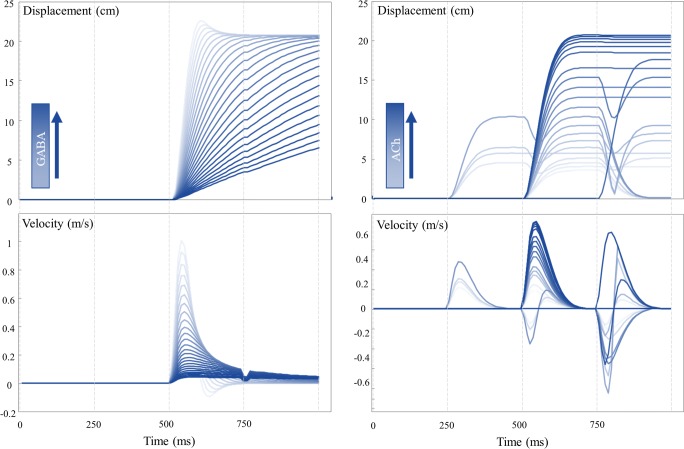
Fig. 3.
Saccade characteristics. The plots on the left show a set of trials with varying levels of GABA (Π from Fig. 1). The upper plot shows the displacement over time through the trial, while the lower plot shows the associated velocity. Note that very low levels of GABA result in an overshoot, that is subsequently corrected, and a higher velocity. In contrast, high levels of GABA lead to slow, hypo-metric saccades. These become broken when the velocity is sufficiently slow that the saccade takes more than one discrete time-step (vertical dashed lines) to complete. The plots on the right show the same characterisation of saccades with varying levels of cholinergic modulation (ζ from Fig. 1). These show a similar, but inverted, phenomenology; with increasing levels of acetylcholine leading to faster saccades. Unlike with the GABAergic changes, there is no hypermetric overshoot. The saccades instead converge to the optimal distance. At low levels of acetylcholine, saccades start to occur too early or late, and in some cases, more than one saccade occurs during a given trial. It is useful to try to infer where the normal physiological range of these parameters may lie—to understand the difference between overdoses or depletions. While this is really an empirical question, best answered by fitting these models to data, we can try to address this issue heuristically. Given that healthy eye movements tend not to overshoot, and that they reach their target displacement quickly, this suggests normal physiological ranges are at the lower end of the GABA scale, and that most of the traces shown above represent excesses above this (with the exception of those that overshoot, which may be depleted). Similarly, the relatively low frequency of inappropriate saccades in healthy people suggests that physiological ranges of acetylcholine are at the higher end of the scale shown here. The improvement elicited by some cholinergic drugs (see main text) suggests that the normal range is not quite at the higher limit shown here

