. 2019 Jun 27;30(9):1790–1800. doi: 10.1007/s13361-019-02254-y
© The Author(s) 2019
Open Access This article is distributed under the terms of the Creative Commons Attribution 4.0 International License (http://creativecommons.org/licenses/by/4.0/), which permits unrestricted use, distribution, and reproduction in any medium, provided you give appropriate credit to the original author(s) and the source, provide a link to the Creative Commons license, and indicate if changes were made.
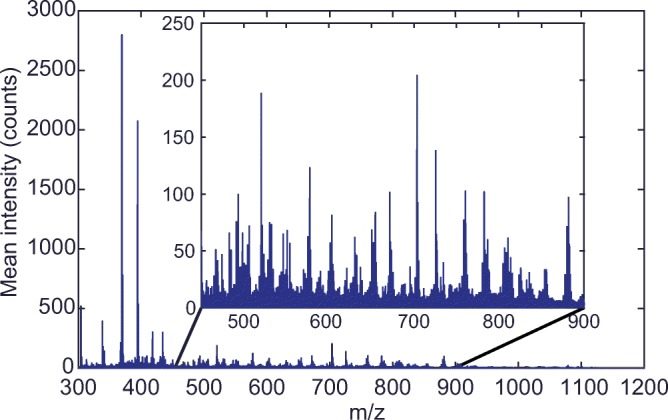
Figure 2.

Typical MALDI-MSI spectrum P1–4 calibrated, mean spectrum, non-normalized
