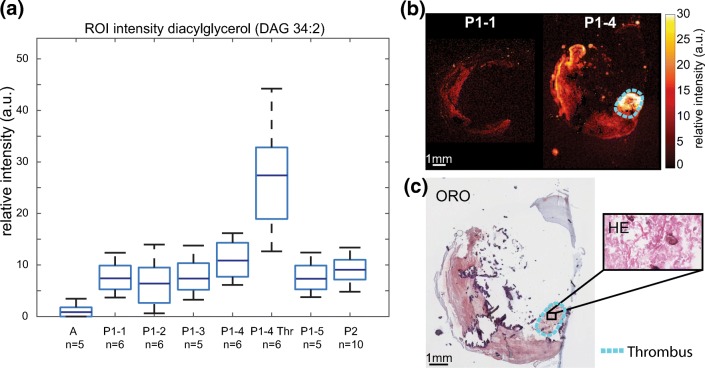
Figure 7.
Distribution of diacylglycerol (DAG) 34:2 (m/z 575.51). (a) Boxplot of average intensity of diacylglycerol (DAG 34:2, [M + H-H2O]+) in a 300 × 300-μm region of interest in tissue segments. Expression in the thrombus-containing ROI of segment P1–4 (P1–4 Thr) is highly elevated. (b) MALDI MSI of P1 segment 1 and 4. The thrombus region is outlined in cyan. (c) ORO staining of MALDI section and HE staining of adjacent section indicating thrombus

