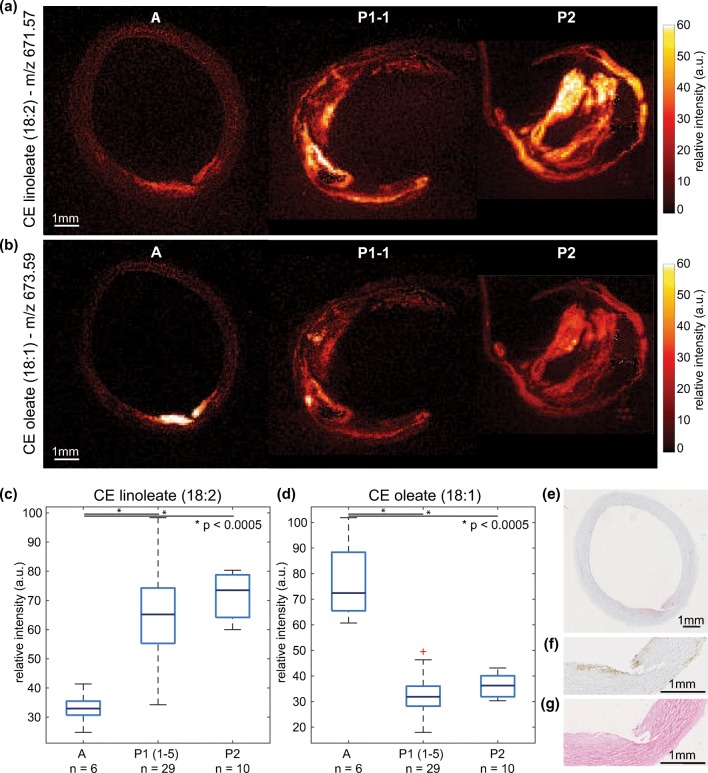
Figure 8.
Distribution of cholesteryl linoleate (m/z 671.57) and cholesteryl oleate (m/z 673.59). (a) MALDI MSI of CE 18:2 in autopsy sample, P1–1, and P2. (b) MALDI MSI of CE 18:1 in autopsy sample, P1–1, and P2. c Box plot of maximum intensity (99th percentile) cholesteryl linoleate (CE 18:2), with over-expression in advanced plaques (P1 and P2), *p value < 0.0005. (d) Box plot of maximum intensity (99th percentile) cholesteryl oleate (CE 18:1), with over-expression in early plaque (autopsy), *p value < 0.0005. (e) Oil Red O staining of MALDI MSI section, showing fatty streak. (f) Immunohistochemistry CD68 stain (zoom, adjacent section), showing macrophages in fatty streak. (g) HE stain (zoom, adjacent section), showing fatty streak

