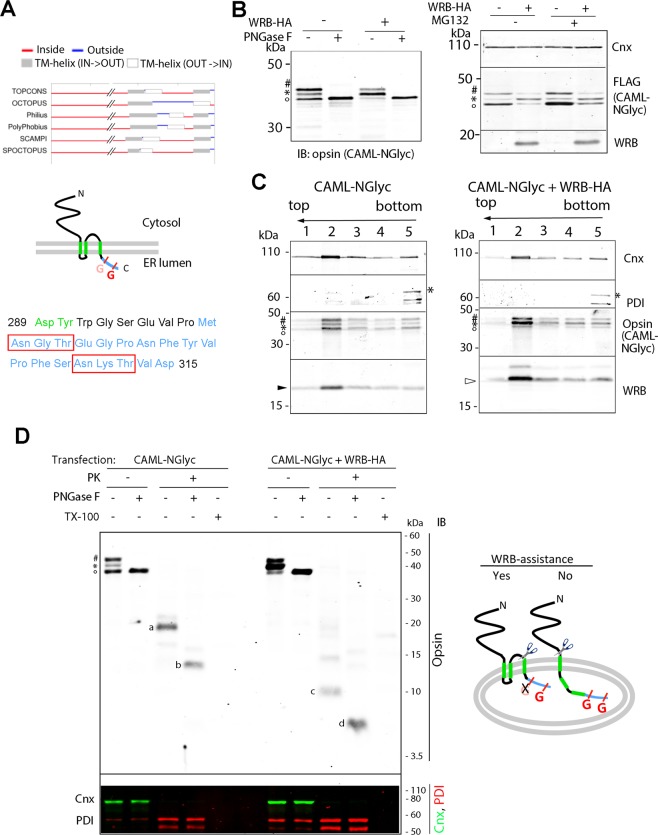
Figure 3.
A tagged CAML construct with two N-glycosylation acceptor sites near the C-terminus reports on the topology of CAML expressed in the presence or absence of WRB-HA. (A) Predicted CAML topology. Top: Comparison of CAML TMs predicted with different scales (TOPCONS54). Middle: The three-TM model for CAML topology predicts that the C-terminus is in the ER lumen. The attached opsin epitope is shown in blue, and its two N-glycosylation sites are indicated (G). The site in pink, because of its proximity to the membrane is expected to remain unused. Bottom: Sequence (blue) of opsin epitope attached to the C-terminal residue of CAML. The last two residues of the predicted third TM are in green. The two N-glycosylation sites are boxed in red. (B) Differences in glycosylation of CAML-NGlyc expressed in the presence or absence of WRB-HA. Left: Lysates from cells expressing CAML-NGlyc either alone or together with WRB-HA were treated or not with PNGase F and analysed by SDS-PAGE/IB. Right: Cells were treated with MG132 or vector for 6 h before lysis. o, *, and # indicate non-glycosylated (0-G), mono-glycosylated (1-G) and di-glycosylated (2-G) forms of CAML-NGlyc, respectively. (C) All three CAML-NGlyc forms are associated with membranes. Membrane fractions were treated with Na2CO3 and subjected to floatation, as in Fig. 2D. Filled and open arrowheads indicate endogenous WRB and WRB-HA, respectively. (D) Cells were semi-permeabilized and treated or not with PK followed by PNGase F. One fifth of the unproteolyzed samples was loaded compared to PK-treated ones. The lower panel demonstrates that lumenal PDI is inaccessible to protease, while the cytosolic Cnx epitope is lost after PK treatment. The cartoon depicts the genesis of the a–d bands detected in the blot of panel A. The 8.5 kDa and 5.5 kDa bands c and d are compatible with the three-TM model, while the 20.5 and 12.5 kDa bands a and b have the size expected if both the second and the third TMs are translocated. Original, uncropped blots of panels B left, B right, C and D are shown in Supplementary Fig. S6A–D, respectively.

