
Figure 6.
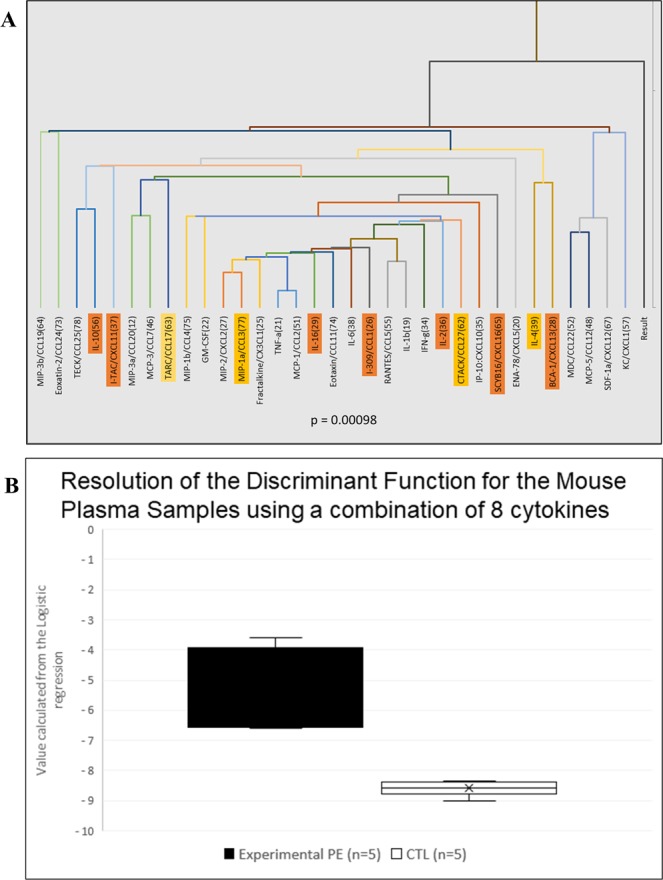
(A) 33 cytokines were analyzed by Luminex technology with the BioPlex kit from BioRad. A correlation analysis was performed to identify cytokines with consistent expression (see text); this approach allows for identifying several markers that behave similarly. Orange are the markers with the largest discriminatory power (see text). (B) 8 cytokines selected for discriminant analysis allowing for generating a linear equation whose coefficients were estimated and unambiguously classifying the 10 mice from the estimated concentrations of these 8 cytokines: Cxcl13, Cxcl16, Cxcl11, Il-16, Il-10, Il-2, Il-4 and Ccl1. The ordinates are the calculated values of the mathematical equation described in the text. The concentration of every cytokine has a multiplicative coefficient, thereby allowing to assign a “cytokine coefficient” to each mouse. Statistics were based on Student t test.