Fig. 3.
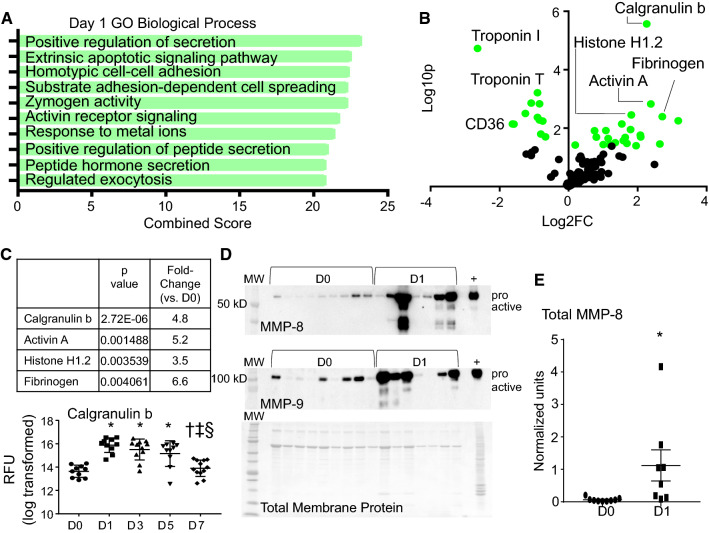
Neutrophil expression profile at day 1 post-MI. a Gene ontology (GO) biological processes enriched in day 1 MI neutrophils. b Volcano plot analysis, with downregulated proteins on the left and upregulated proteins on the right. Proteins with p values < 0.05 are shown in green. c Calgranulin b and IL-16 were upregulated at MI days 1 and 3. *p < 0.05 vs. D0, †p < 0.05 vs. D1, ‡p < 0.05 vs. D3, and §p < 0.05 vs. D5; and sample sizes are n = 10 day 0, n = 10 day 1, n = 11 day 3, n = 10 day 5, and n = 12 day 7. d MMP-8 and MMP-9 immunoblotting showed strong upregulation at MI day 1 (total membrane protein stain at the bottom). e Quantification of MMP-8 immunoblotting. *p < 0.05, sample sizes are n = 9 for day 0 and 8 for MI day 1

