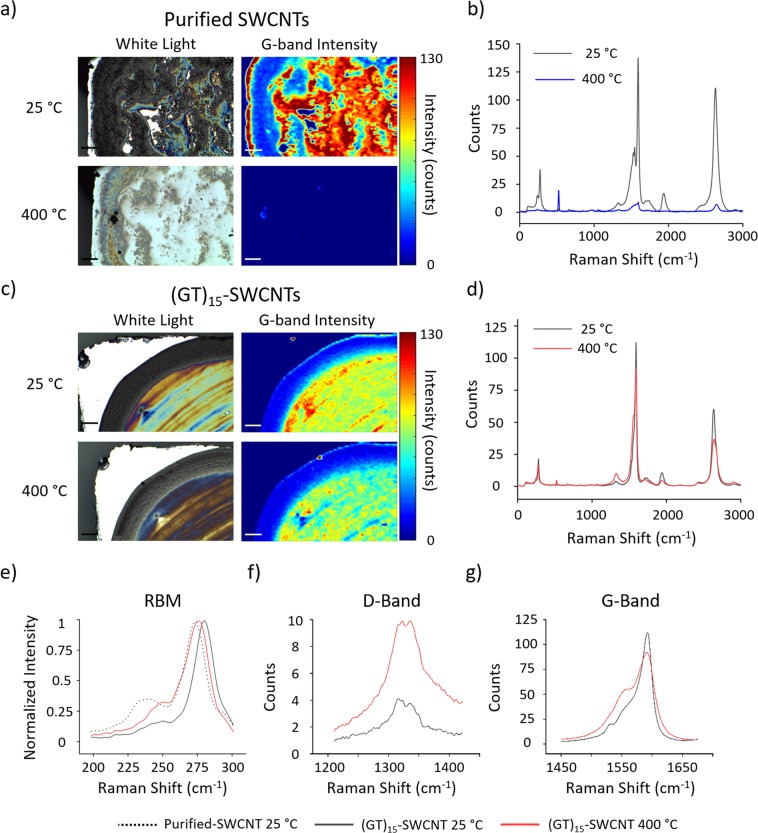
Figure 3.
Brightfield images and G-band confocal Raman intensity maps of (a) purified SWCNTs and (c) (GT)15-SWCNTs dried on silicon wafers before and after a 30-minute exposure to 400 °C. The average spectra of SWCNT-containing pixels in confocal Raman area scans of (a,c) are shown in (b,d) respectively. Average Raman spectra zoomed-in to show detail in (e) normalized RBM, (f) D-band, and (g) G-band of (GT)15-SWCNTs at room temperature and after a 30-minute exposure to 400 °C. Scale Bar = 100 μm.

