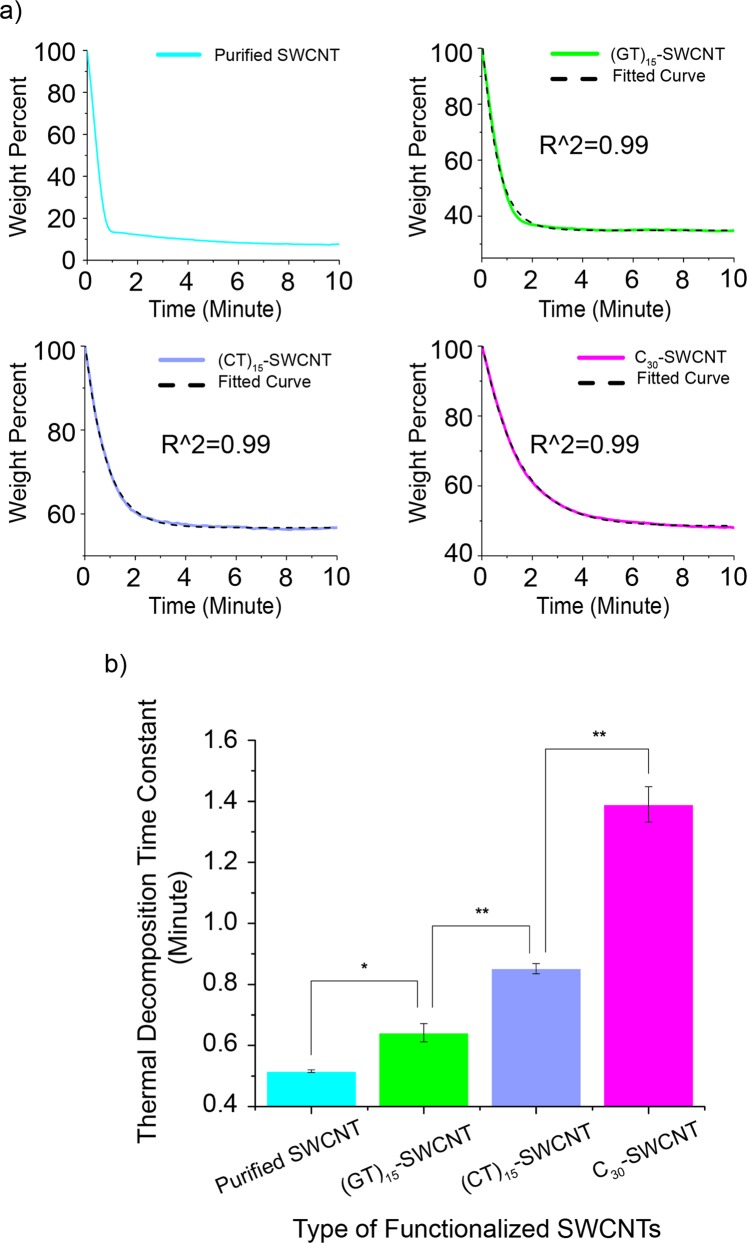
Figure 5.
(a) Weight percent versus time profiles for purified SWCNTs, and DNA-SWCNTs composed of (GT)15, (CT)15, or C30 DNA sequences, when the temperature is instantaneously increased from 400 to 700 °C. The data are fitted to a single exponential decay and the resultant curve is plotted as a black dotted line. (b) Bar graph to compare the thermal decomposition rate (1/thermal decomposition time constant) of raw SWCNTs and DNA-SWCNTs made from (GT)15, (CT)15, or C30 DNA sequences. TGA was repeated three times (n = 3) for each sample. A two-sample t-test was performed (*p < 0.05, **p < 0.01).

