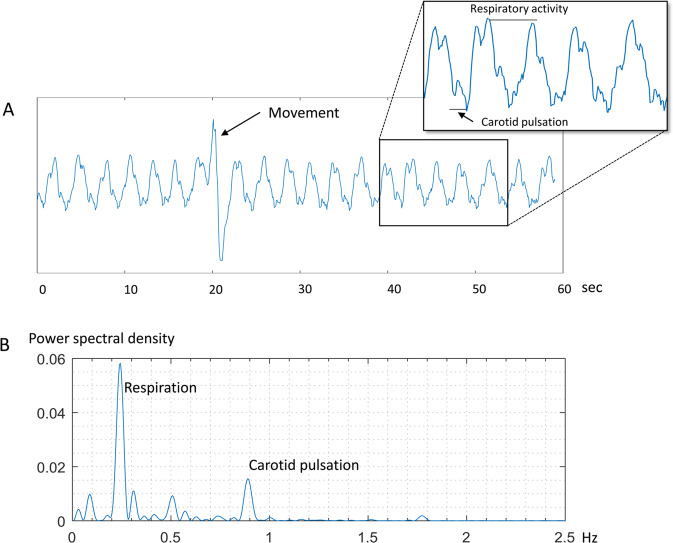
Figure 3.
Examples of signals measured using IR-UWB radar. The radar signals mainly consisted of cyclic oscillations generated by respiratory activity. Each time the subject moved, a large fluctuation occurred in the signal (A). In the power density spectrum, the signals from respiratory activity occupied the most prominent frequency, approximately between 0.25 Hz and 0.5 Hz, and the signals from carotid pulses occupied the second most prominent frequency, at approximately 0.89 Hz, as its harmonic component (B). The power of the respiratory activity signal was approximately 6.3 dB larger than that of the carotid pulsation signal.

