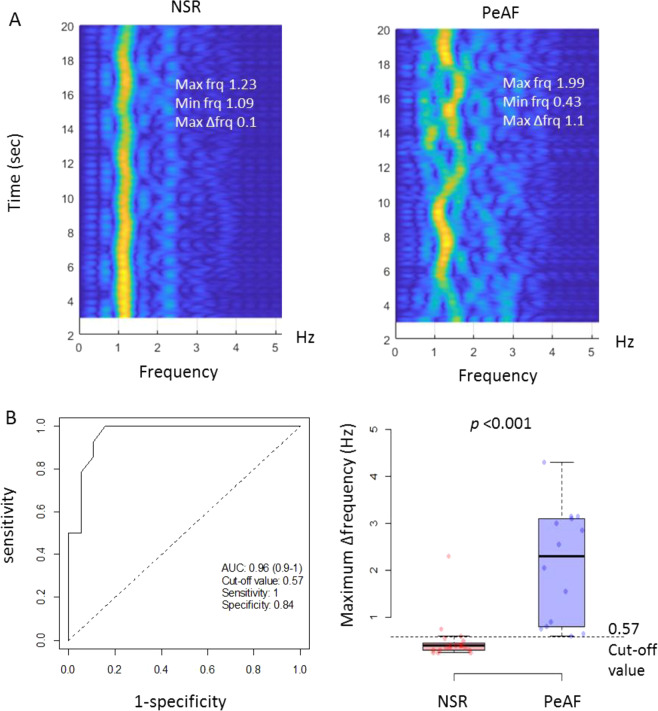
Figure 8.
Differentiation between NSR and PeAF by the analysis of the frequency domain. The frequencies of the radar signal intensities were color-coded and plotted against time on 2-dimensional spectrograms (A). The brighter-colored line represents the frequency at the peak signal intensity. The Max∆frq appeared to be greater in the patients with PeAF (1.1 Hz) than in those with NSR (0.1 Hz). In the receiver operating characteristic curve analysis, the Max∆frq showed very high diagnostic performance for PeAF at a threshold of 0.57 Hz (B). NSR, normal sinus rhythm; PeAF, persistent atrial fibrillation; Max, maximal; Min, minimal; frq, frequency; Max∆frq, maximum frequency variation in the peak signal intensity.

