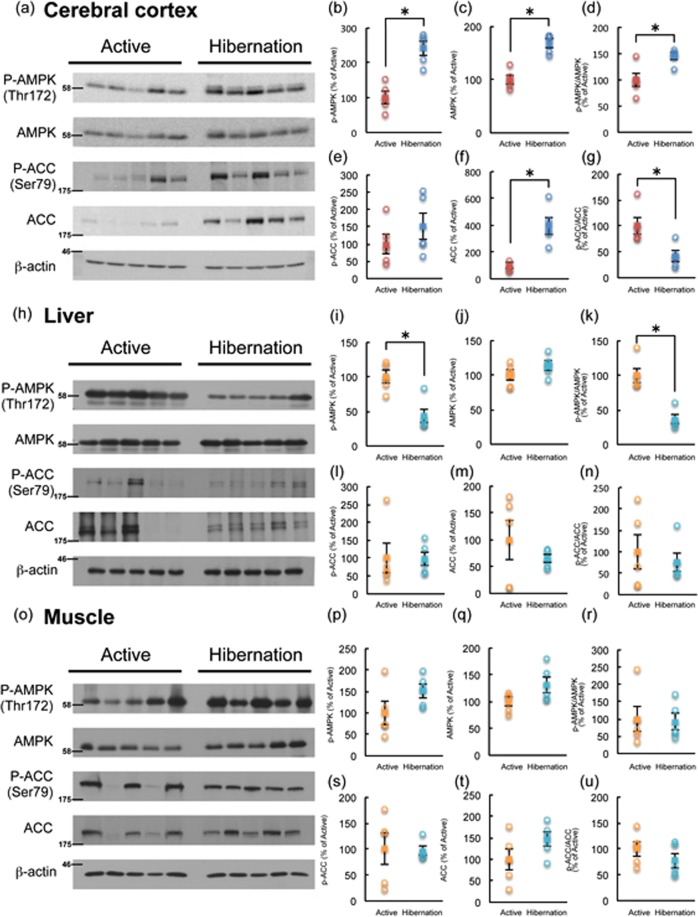
Figure 3.
Phosphorylation of AMPKα and ACC in the cerebral cortex (a–g), liver (h–n), and skeletal muscle (o–u) of chipmunks during active and hibernation periods as revealed by Western blotting. All the samples were applied to the same gel and blotted to single membrane as displayed. Each band was quantified by Image J. (b,i,p); P-AMPKα, (c,j,q); AMPKα, (d,k,r); ratio of P-AMPKα/AMPKα, (e,l,s); P-ACC, (f,m,t); ACC, (g,n,u); ratio of P-ACC/ACC. Circles represent each band. Squares represent mean ± SE (n = 5). *p < 0.05 (Wilcoxon rank-sum test (g,i,k,l,n) or Student’s t-test (all the rest)).

