Figure 1.
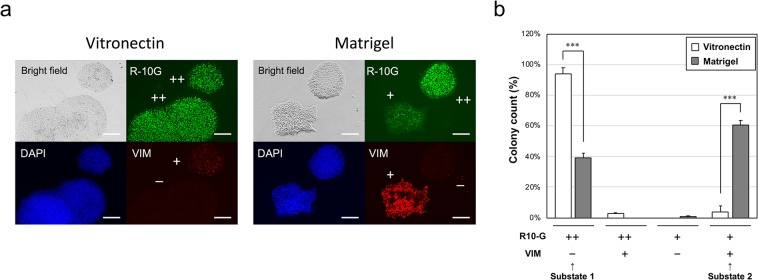
Expression pattern analysis of R-10G epitope and vimentin in H9 cells grown on vitronectin and Matrigel. (a) Immunohistochemistry with no permeabilisation using antibodies for a pluripotency marker (R-10G epitope) and a mesenchymal marker (vimentin [VIM]). Nuclei were counterstained with DAPI. The expression levels of R-10G epitope and VIM were classified as “++” and “+” or “+” and “−”. The scale bar represents 200 µm. (b) Colony distributions for R-10G epitope and VIM expression patterns. The colonies were manually counted (n = 100, in triplicate). Values are the means ± standard errors. *** indicates P < 0.001 by unpaired two-tailed t-tests. R-10G++/VIM− and R-10G+/VIM + colonies were classified as “substate 1” and “substate 2”, respectively.

