Figure 5.
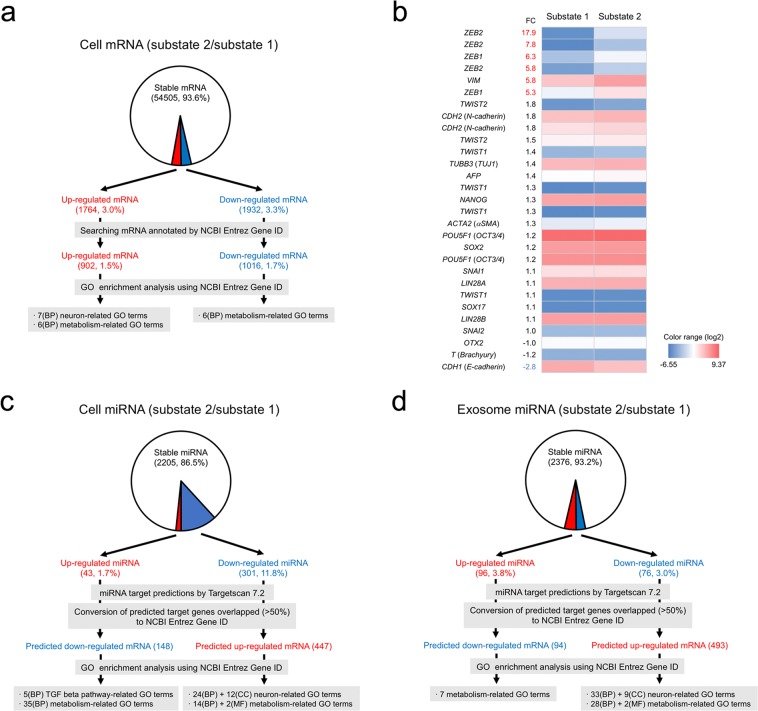
mRNA and miRNA expression analysis for cells in substate 1 and substate 2. (a) mRNA microarray analysis. Analysis of significance was performed using Z-score of substate 2 versus substate 1 (see Supplementary Fig. S1). The symbols of the obtained mRNAs were converted to NCBI Entrez Gene IDs by BioMart based on GRCh38.p12. GO enrichment analysis was performed using the IDs (false-discovery rate [FDR] ≤ 0.05, fold enrichment ≥ 1.5; see Supplementary Tables S2–S3). (b) Heat map showing pluripotency, epithelial-to-mesenchymal transition, and trilineage markers. The map was constructed using the mRNA microarray data of pluripotency markers (CDH1 [E-cadherin], CDH2 [N-cadherin], LIN28A, LIN28B, NANOG, POU5F1 [OCT3/4], and SOX2), epithelial-to-mesenchymal transition markers (SNAI1, SNAI2, TWIST1, TWIST2, ZEB1, ZEB2, and VIM), and trilineage markers (ACTA2 [aSMA], AFP, OTX2, SOX17, T [brachyury], and TUBB3 [TUJ1]) (see Supplementary Table S4). The red and blue coloured fold change (FC) numbers indicate significantly higher and lower expression in substate 2 than in substate 1, respectively. (c and d) miRNA microarray analysis of the cells (c) and exosomes (d). The miRNAs that showed a 2-fold difference in expression between substate 1 and substate 2 cells were subjected to analysis of significance using paired t-test with multiple testing correction (q < 0.05; Supplementary Tables S5–8). The miRNA target prediction was performed by Targetscan 7.2. The predicted up- and downregulated mRNAs were derived from the down- and upregulated miRNAs, respectively (see Supplementary Tables S9–S12). The symbols were converted to NCBI Entrez Gene IDs using BioMart based on GRCh38.p12 (see Supplementary Tables S9–S12). GO enrichment analysis was performed using the IDs of genes targeted by more than 50% miRNAs (false-discovery rate [FDR] ≤ 0.05, fold enrichment ≥1.5; see Supplementary Tables S13–S16).

