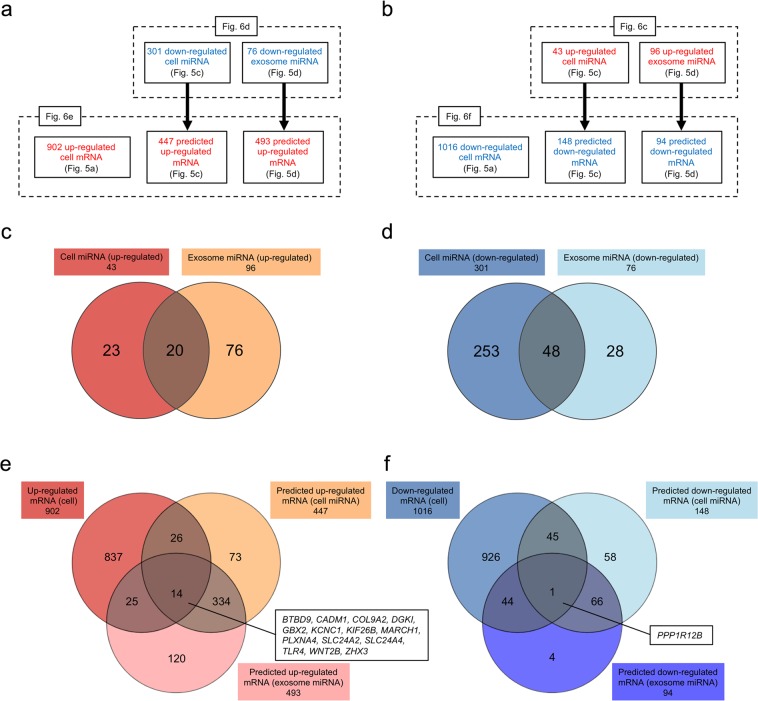
Figure 6.
Integrated analysis mRNAs and predicted mRNAs targeted by miRNAs between substate 1 and substate 2. (a,b) Schematic diagram of integrated analysis of mRNA and miRNA microarrays. (c) Venn diagram of upregulated miRNAs from cells and exosomes. The miRNAs used are indicated in Fig. 5c,d and in Supplementary Tables S5 and S7. The upregulated miRNAs common to the cells and exosomes are shown in Supplementary Table S17. (d) Venn diagram of downregulated miRNAs from cells and exosomes. The miRNAs used are shown in Fig. 5c,d and in Supplementary Tables S6 and S8. The downregulated miRNAs common to the cells and exosomes are shown in Supplementary Table S18. (e) Venn diagram of upregulated mRNAs and predicted upregulated mRNAs targeted by downregulated miRNAs. The mRNAs in Supplementary Fig. S1, Supplementary Table S10, and Supplementary Table S12 were used. The upregulated mRNAs common to upregulated cell mRNAs and predicted upregulated mRNAs from miRNAs of cells and exosomes are shown in Supplementary Table S19. (f) Venn diagram of downregulated mRNAs and predicted downregulated mRNAs targeted by upregulated miRNAs. The mRNAs in Supplementary Fig. S1, Supplementary Table S9, and Supplementary Table S11 were used. The downregulated mRNAs common to downregulated cell mRNAs and predicted downregulated mRNAs from miRNAs of cells and exosomes are shown in Supplementary Table S20.

