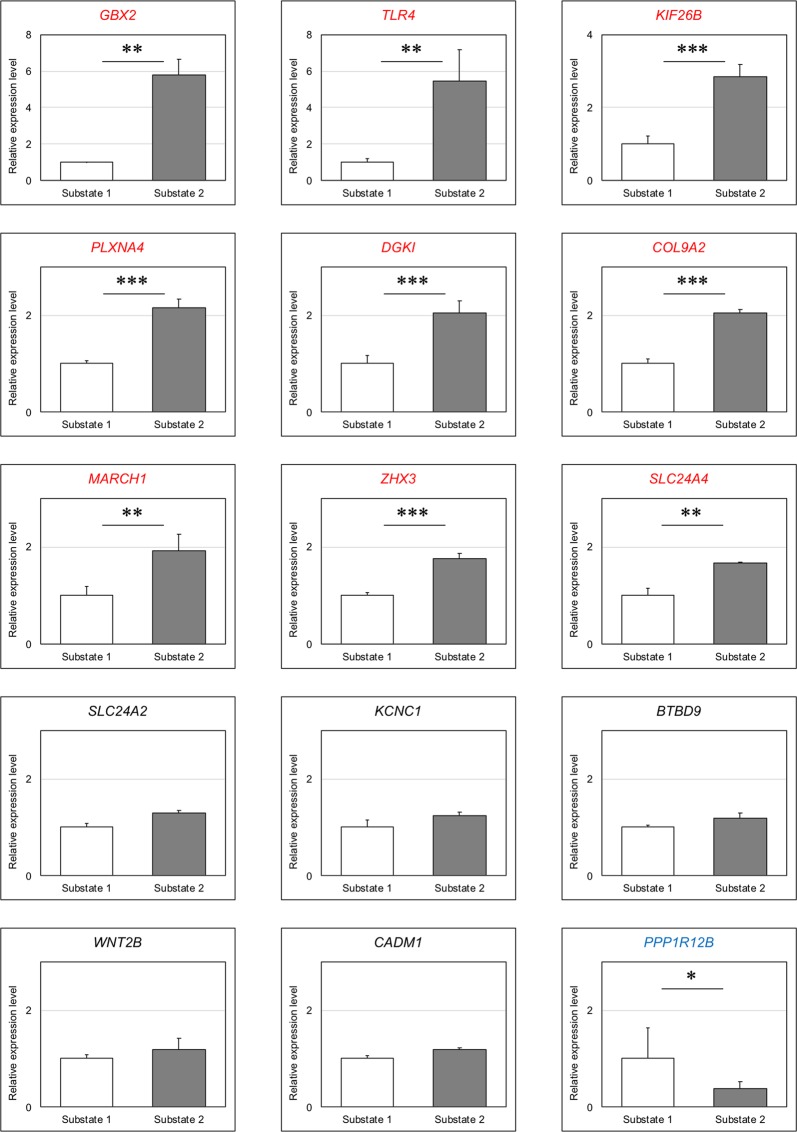
Figure 7.
Expression analysis of biomarker candidates for the earliest stages of ectodermal differentiation. One-step real-time RT-PCR analysis of 14 upregulated mRNAs (BTBD9, CADM1, COL9A2, DGKI, GBX2, KCNC1, KIF26B, MARCH1, PLXNA4, SLC24A2, SLC24A4, TLR4, WNT2B, and ZHX3) and one downregulated mRNA (PPP1R12B) in substate 2 of integrated analyses of mRNA and miRNA was performed using RNAs derived from substate 1 and substate 2 cells. The expression of GAPDH was used for normalization. Values are the means ± SDs (n = 3). mRNAs that showed a 1.5-fold difference in expression between substate 1 and substate 2 cells were subjected to analysis of significance using unpaired two-tailed t-tests (*P < 0.1; **P < 0.05; ***P < 0.01). Red and blue gene symbols indicate upregulated and downregulated mRNAs, respectively.

