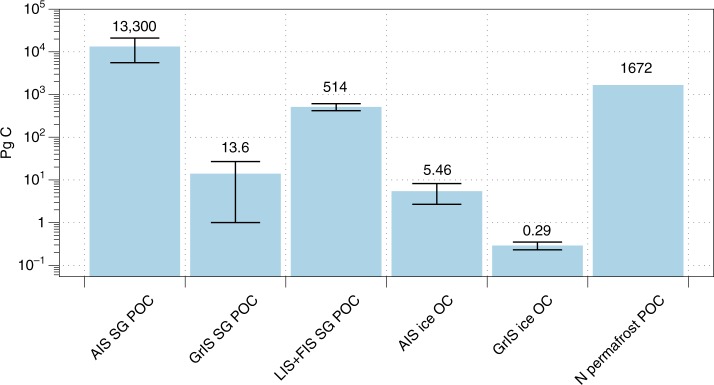
Fig. 3.
Carbon inventories for present day and former ice sheets. Data presented includes minimum, mid-range and maximum estimates. Antarctic Subglacial POC (AIS SG POC), minimum estimates are calculated assuming a sediment depth of 1 km, sedimentary basin areas of 1 × 10⁶ km2 for WAIS and 2.5 × 10⁶ km2 for EAIS, a rock density of 2650 kg m-3, a porosity of 0.3 and a POC of 0.1%169, maximum estimates are derived from ref. 169. and mid-range values as the average between the two, Greenland Ice Sheet Subglacial POC (GrIS SG POC, minimum estimates calculated assuming a POC of c. 0.2%170, sediment thicknesses of 0.1 m171 and a porosity of 0.4172, maximum estimates assuming a POC of 0.44%36, sediment thicknesses of 2 m171 and a porosity of 0.3172 and mid-range values as the average between the two), Laurentide + Fennoscandian Ice Sheet Subglacial POC (LIS + FIS SG POC, minimum, maximum and mid-range estimates from ref. 18), Antarctic Ice Sheet englacial POC + DOC (AIS ice OC, mid-range, minimum and maximum values from ref. 9, where the min/max values only include DOC due to lack of data), Greenland Ice Sheet ice-bound POC + DOC (GrIS ice OC, mid-range, minimum and maximum values from ref. 9, where the min/max values only include DOC due to lack of data) and Northern hemisphere permafrost (N permafrost POC)97

