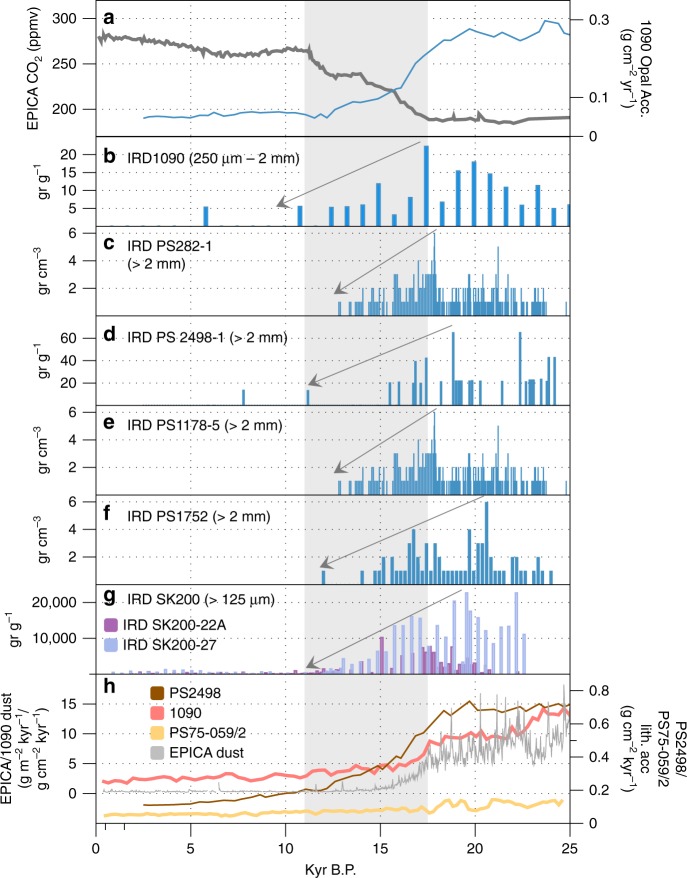
Fig. 5.
Temporal variability in the Southern Ocean. Temporal variation in atmospheric CO2, marine opal accumulation, Ice-rafted debris (IRD) and total lithogenic inputs to the Southern Ocean over the past 25 ka: a atmospheric CO2 concentrations (EPICA Dome C, dark grey line) and opal accumulation in sub-Antarctic cores 1090/PS2498-1174 (blue line)151, (b) IRD in core 1090159, (c) IRD in core PS282-1 where the IRD data are from ref. 160 and the Depth/Age model is from Ref. 175, (d) IRD in core PS2498-1 where the IRD data are from ref. 160 and the Depth/Age model is from ref. 151, (e) IRD core PS1778-5, where the IRD data are from ref. 160 and the Depth/Age model is from ref. 176, (f), IRD in core PS1752, where the IRD data are from ref. 160 and the Depth/Age model is from ref. 177. g IRD in cores SK200-22A and SK200-27 from the Indian Ocean sector of the Southern Ocean161. h Lithogenic fluxes to the Southern Ocean for marine cores 1090137, PS2498-1151 and PS75-059/2152 alongside the EPICA Dome C dust flux record. The shaded area indicates the period of maximum CO2 increase during deglaciation. See Supplementary Fig. 3 for core locations

