
Figure 4.
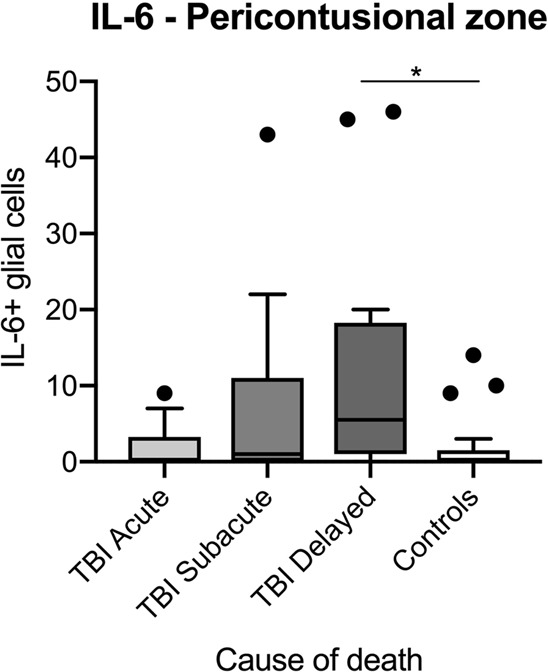
Box plot diagrams displaying the different total numbers of IL-6-positive glial cells (counted in ten digital images at a 200x magnification) depending on the survival time of traumatic brain injury (TBI) fatalities compared to the controls. The outlines of the boxes indicate the 25% and 75% percentile, the solid black line the median. End of lines show the minima and maxima. Outliers (>1.5 interquartile range) are depicted as a bold point. *p < 0.05 using Kruskal-Wallis test followed by post hoc Dunn’s test.