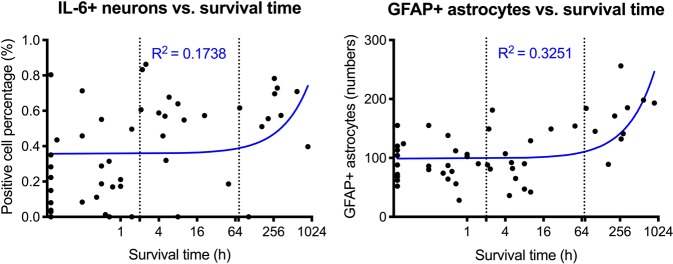
Figure 6.
Scatter plots and corresponding blue regression lines depicting the association between IL-6 positive neurons (left) and GFAP positive astrocytes (right) in the pericontusional zone with the trauma survival time in hours (h), x axis presented as logarithm. For better visualization, the case with the longest survival time was not illustrated in the figure but was included in the statistical calculations. For IL-6: r = 0.27, p = 0.0309; for GFAP: r = 0.57, p < 0.001. The vertical dashed lines mark the time intervals between the survival time categories at 2 h and 72 h.

