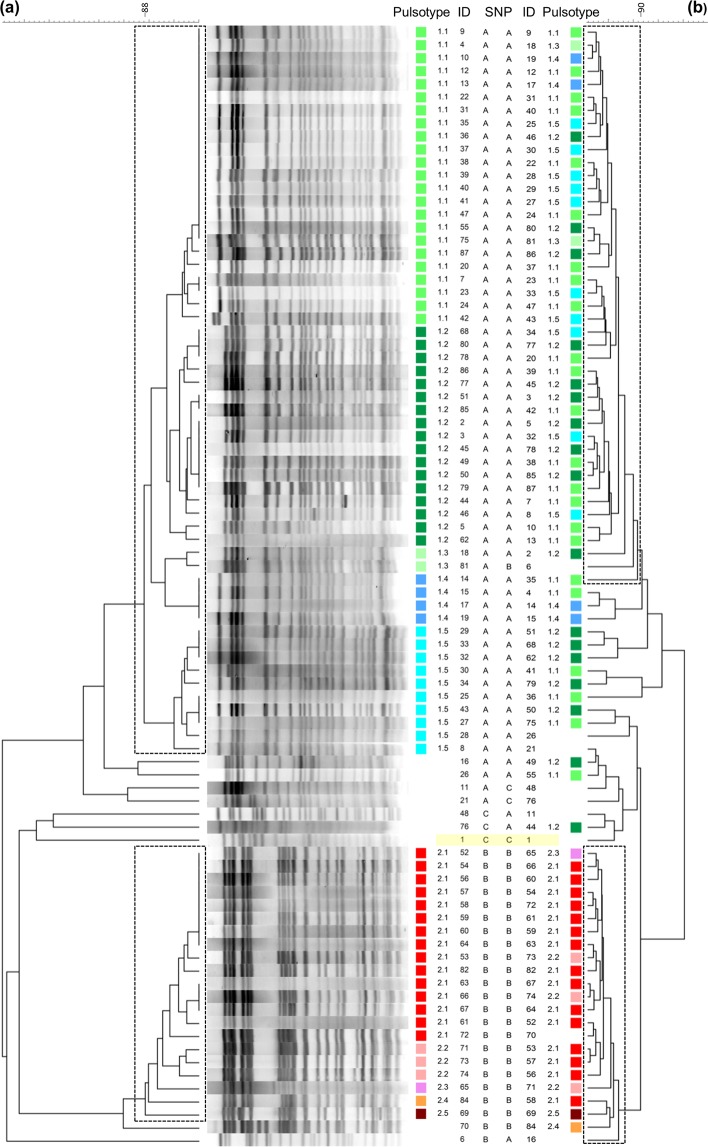
Figure 2.
Clustering of the SØ12 VRE isolates. (a) Dendrogram of SmaI macro-restriction pattern resolved in PFGE of VRE E. faecium with vanA. The UPGMA tree illustrates the distance between isolates. The two boxes show the two main clusters of isolates displaying >88% similarity, while the pulsotypes defined with >94% similarity and visual inspection are differentiated with colors and number. Pulsotype 1.1–1.5 (green/blue) belongs to cluster 1, while pulsotype 2.1–2.5 (red/pink/brown) belongs to cluster 2. The index case strain (ID 1) is highlighted with a yellow box. (b) Dendrogram of the same isolates of VREfm resolved with MALDI-TOF MS. The two boxes indicate the two main clusters identified with >90% similarity. The pulsotypes are assigned by PFGE in (a).

