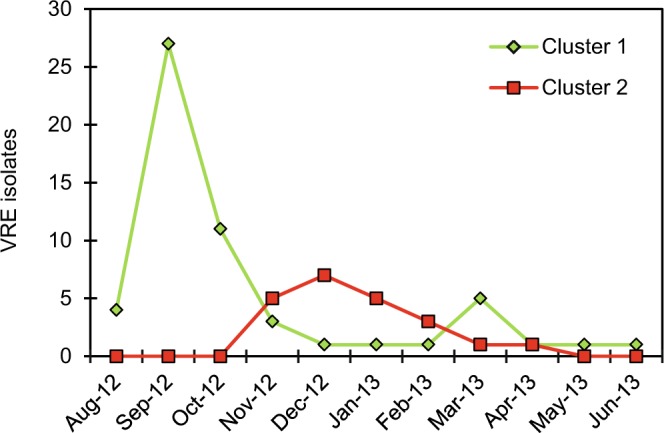
Figure 3.

Monthly distribution of cluster 1 and cluster 2 related strains. Strains belonging to cluster 1 (green line) and cluster 2 (red line) are defined by >88% similarity by PFGE during the outbreak period. Strains unrelated to the two main clusters are not included in the chart. Most of the isolates in cluster 1 were found during screening September and October 2012, concurrent with the decline of positive isolates related to strains in cluster 1, cluster 2 related strains were introduced in November 2012.
