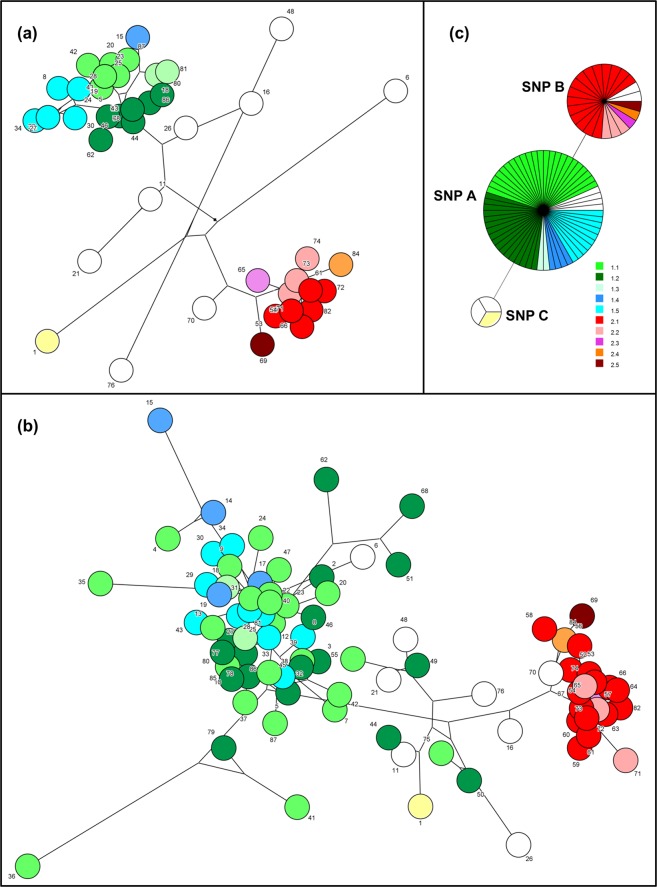
Figure 4.
Minimum spanning trees demonstrating the relatedness among SØ12 E. faecium isolates. The network length between the isolates based on cluster analysis of the (a) PFGE, (b) MALDI-TOF and (c) SNP results are shown. Pulsotypes are indicated with colors; green and blue correspond to isolates in cluster 1, while red and pink correspond to isolates in cluster 2. Unrelated strains are illustrated colorless, except for the index case strain in yellow color. For PFGE, the total network length is 447, and for MALDI-TOF the length is 358. The SNP results are viewed as minimum spanning tree (MST).

