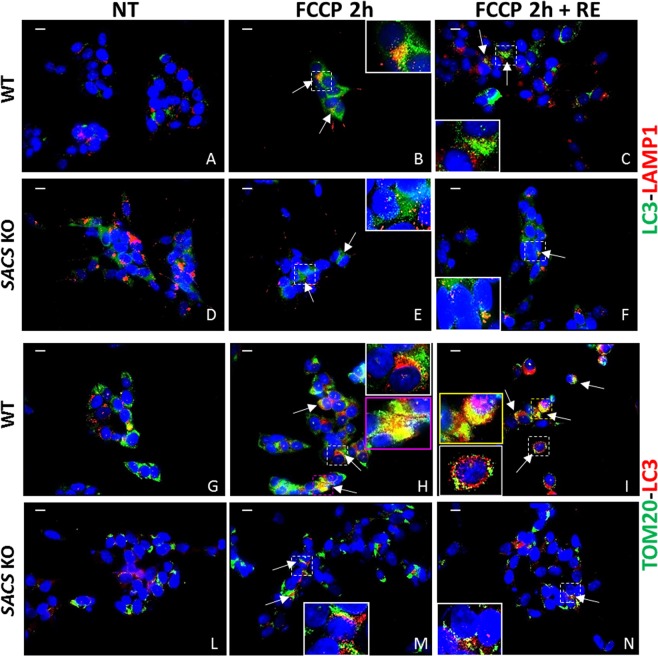
Figure 6.
Mitophagy is impaired in sacsin KO cells. (Panels A–F) Autophagosome-lysosome fusion is disrupted in sacsin KO cells. Immunofluorescence images of LC3 (in green) and LAMP1 (in red) in WT and sacsin KO cells under normal conditions (A,D), FCCP treatment (B,E) and FCCP treatment followed by medium recovery (C,F). DAPI (in blue) was used as nuclear stain. Fusion between autophagosomes and lysosomes was reduced in sacsin KO cells even after medium recovery. Colocalization of LC3 with LAMP1 (in yellow) is indicated by arrows. (Panels G–N) Mitophagy activation is reduced in KO cells. Immunofluorescence images of the mitochondrial marker TOM20 (in green) and LC3 (in red) in WT and sacsin KO cells under normal conditions (G,L) FCCP treatment (H,M) and FCCP treatment followed by medium recovery (I,N). DAPI (in blue) was used as nuclear stain. Fusion between mitochondria and autophagosomes was reduced in sacsin KO cells even after medium recovery. Colocalization of LC3 with TOM20 (in yellow) is indicated by arrows. Scale bar = 10 µm. (Re = normal medium recovery).

