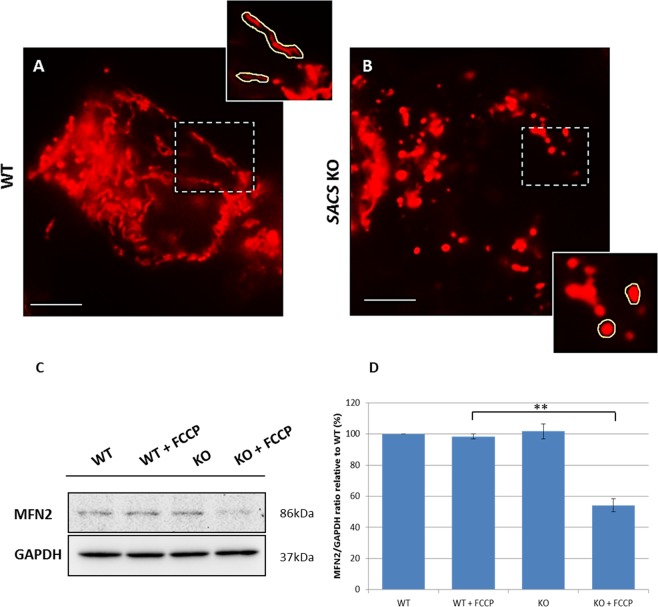
Figure 7.
Mitochondrial pattern is disrupted in sacsin KO cells. (Panels A,B) Representative images showing WT and KO cells that were stained with MitoTracker (in red) under normal conditions. Mitochondria appeared more fragmented in KO cells as opposed to WT cells as highligthed by yellow border in the magnification inserts. Scale bar = 10 µm. (C) Western blotting of MFN2 in WT and KO cells in the presence or absence of the mitochondrial uncoupler FCCP (20 µM, 2 h). Full-length blots are presented in the Supplementary Information 4. (D) Densitometry of protein bands normalized versus GAPDH showed a significant reduced steady-state levels of MFN2 in KO cells after FCCP treatment. **p < 0.01.

