
Figure 1.
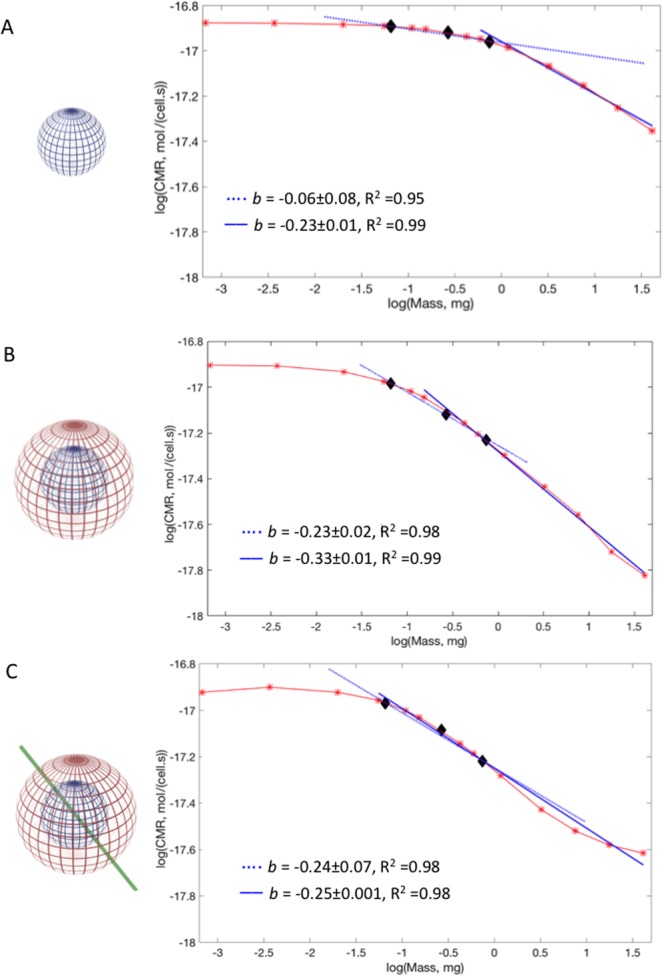
Model representations and computed CMR (red asterisks (*)) against mass for (A) shell-free constructs. (B) Constructs with a hydrogel shell; (C) constructs with a hydrogel shell and a micro-vessel. The experimental range of organoid masses in Table 1 are black diamonds (w). Blue dotted line: least squares fit for the experimental range of masses. Blue full line: best fit. The slopes (b) and corresponding R2 values are indicated in the plots.