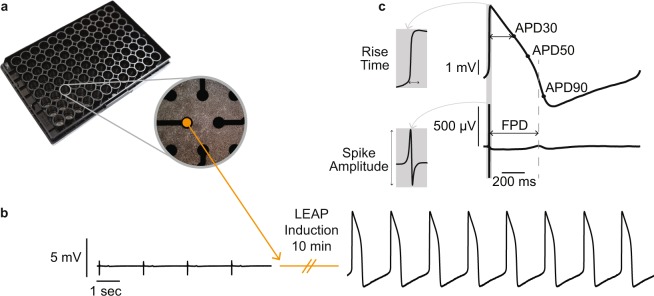
Figure 1.
LEAP induction transforms field potentials to action potentials. (a) CytoView MEA 96-well plate with inset showing Bright Field 4x Magnification image of iCell CM2 cultured in a single well atop eight planar microelectrodes. (b) Example signal transformation on a single planar electrode from before and after LEAP induction. (c) LEAP and FP waveforms (averaged across 5 beats) recorded from neighboring electrodes in the same well. Markers for depolarization (LEAP: rise time; FP: AMP) and repolarization (LEAP: APD at various stages of repolarization; FP: FPD) are indicated. Gray dashed line highlights that FPD occurs between APD50 and APD90.

