
Figure 3.
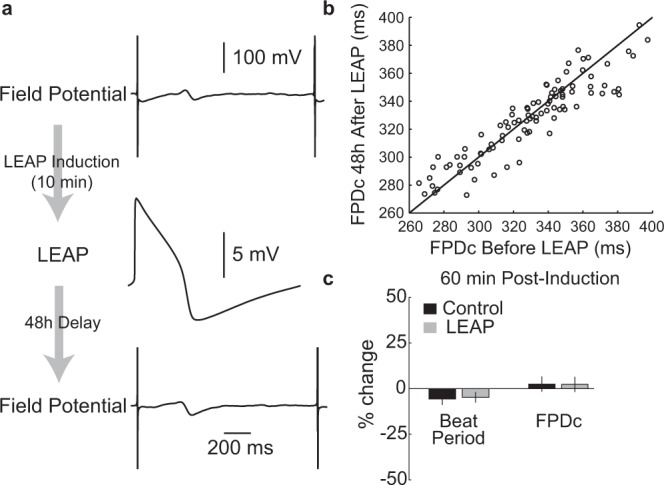
LEAP does not disrupt cardiomyocyte function or behavior. (a) FPs were recorded before and 48 hours after LEAP induction on all electrodes of a Classic MEA 96-well plate with iCell CM2. The FP was not affected by LEAP induction. (b) FPDc before and after LEAP were tightly correlated (R2 = 0.84, p < 0.001). Each dot represents the FPDc before and 48 hours after LEAP induction for a well, with the unity line in black for comparison. (c) Here, LEAP induction was applied to half of the electrodes in half of the wells on a Classic MEA 96-well plate with iCell CM2. FPs were recorded before and 60 minutes after LEAP induction. Bar plots represent the percent change (mean ± standard deviation across wells) in BP and FPDc, measured from the FP signal, from before to 60 minutes post-LEAP induction. Changes in BP and FPD did not differ between control (no LEAP) and LEAP wells (Mann Whitney U-Test, BP p = 0.097, FPDc p = 0.77).