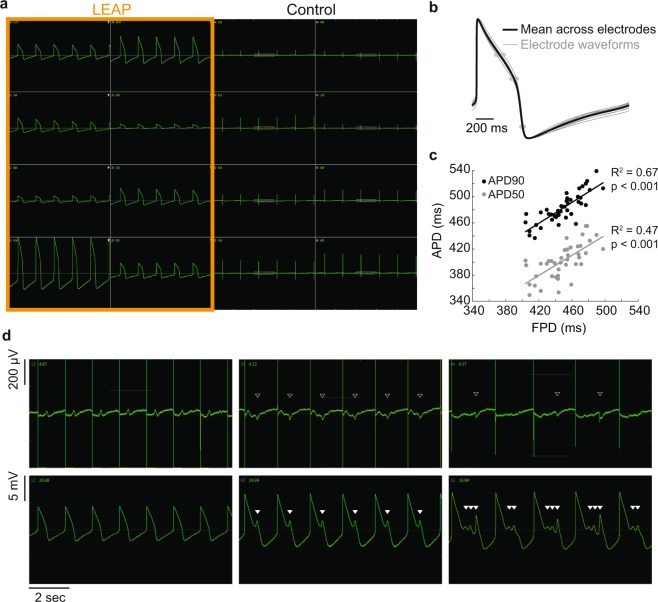
Figure 4.
Simultaneous LEAP and FP measurements establish translation between FP and AP signals. LEAP was induced on half of the microelectrodes in each well of a Classic MEA 48-well plate of iCell CM2. (a) Representative well showing LEAP waveforms from eight electrodes (left) and FPs from eight electrodes (right). (b) Despite differences in signal amplitude, LEAP shapes were consistent across electrodes in a well. LEAP waveforms (averaged across 5 beats) from each of eight electrodes are shown in gray with the mean across electrodes overlaid in black. APD30, 50, and 90 are marked with gray dots on each electrode trace. (c) APD90 and 50 were correlated with FPD across all wells. Each dot represents the FPD and APD90 (black) or APD50 (gray) from a single well (n = 48 wells). A best fit linear regression is plotted for APD90 (black) and APD50 (gray) as a function of FPD (t-test for slope vs zero, p < 0.001). (d) Example FP and LEAP signals from the same well when dosed with DMSO (left) or E-4031 (middle, right). With vehicle control, depolarization and repolarization aligned between the FP and LEAP. With hERG block, both the FP and LEAP were prolonged and EADs developed. EADs were automatically detected on the LEAP signals (filled white triangles) and visually identified on the FP (open white triangles) for direct comparison of features.

