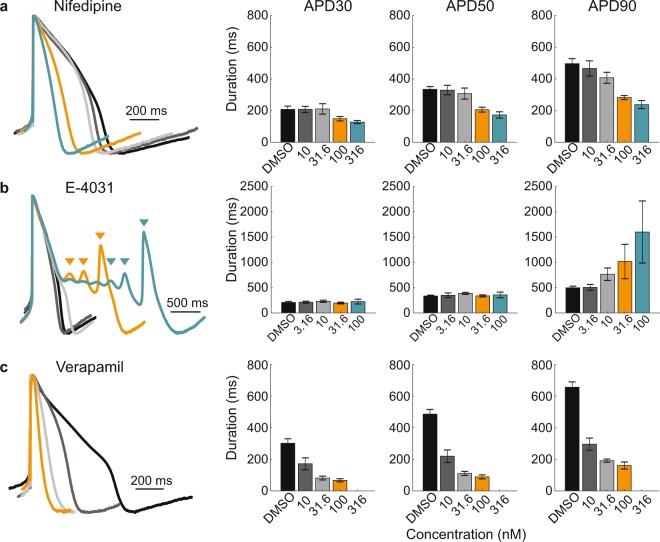
Figure 5.
LEAP signals reproduce expected responses to ion channel blockers. Cardiomyocytes (iCell CM2) plated on Classic MEA 48-well plates were dosed with vehicle control or one of four doses of Nifedipine (a), E-4031 (b), and Verapamil (c). For each compound, amplitude normalized LEAP waveforms (averaged across 5 beats) from representative wells are overlaid for DMSO (black) and the four increasing concentrations of each compound (dark gray, light gray, orange, and teal). Triangles indicate automatically detected EADs. Bar plots represent the mean ± standard deviation of APD30, 50, and 90 across replicate wells (n = 8 for DMSO, n = 5 for each concentration of Nifedipine and E-4031, n = 3 for each concentration of Verapamil). The highest dose of Verapamil stopped cardiomyocyte beating.

