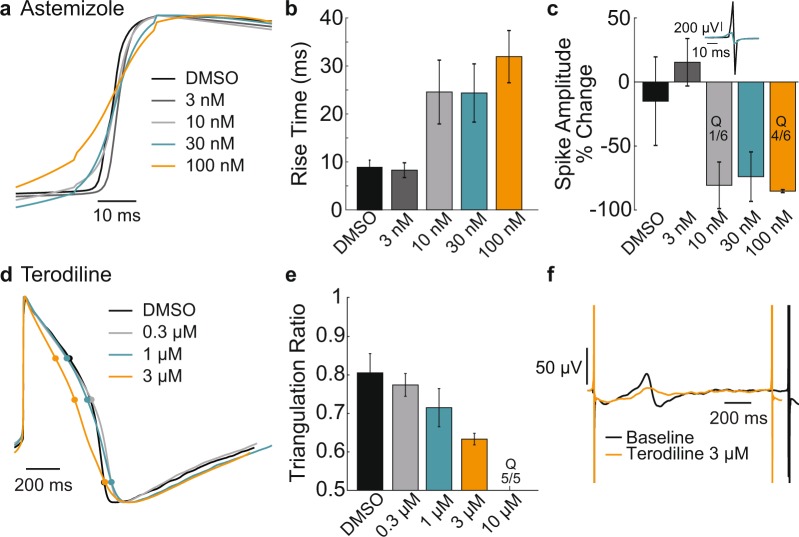
Figure 6.
LEAP quantifies rise time and triangulation to reveal subtle changes in action potential morphology. (a) Coyne hiPSC-derived cardiomyocytes were plated on a Classic MEA 96-well plate and dosed with vehicle control or one of four doses of Astemizole (a,b,c). The rising phase of LEAP waveforms (averaged across 5 beats) from representative wells are overlaid for DMSO (black) and the four increasing concentrations of Astemizole (dark gray, light gray, teal, orange). Astemizole prolonged the rise time of the AP. (b) Bar plots represent the mean ± standard deviation of rise time across replicate wells (n = 13 for DMSO, n = 6 for each concentration of Astemizole). One of six wells became quiescent (Q) in response 100 nM of Astemizole. (c) Prolonged rise time corresponded to a reduction in FP AMP, with several wells becoming quiescent (Q) particularly at higher doses. (d) iCell CM2cardiomyocytes were dosed with vehicle control or one of four doses of Terodiline (d,e,f). LEAP waveforms (averaged across 5 beats) from representative wells are overlaid for DMSO (black) and three increasing concentrations of Terodiline (light gray, teal, orange). Terodiline shutdown beating in all replicates at the fourth and highest dose (Q, 10 µM). (e) Bar plots represent the mean ± standard deviation of the triangulation ratio across replicate wells (n = 10 for DMSO, n = 5 for each concentration of Terodiline). (f) AP triangulation corresponded to broadening and shrinking of the T-wave of the corresponding FP. FPs (averaged over 5 beats) at baseline (black) and dosed with 3 µM Terodiline (teal) are shown for a representative well.

