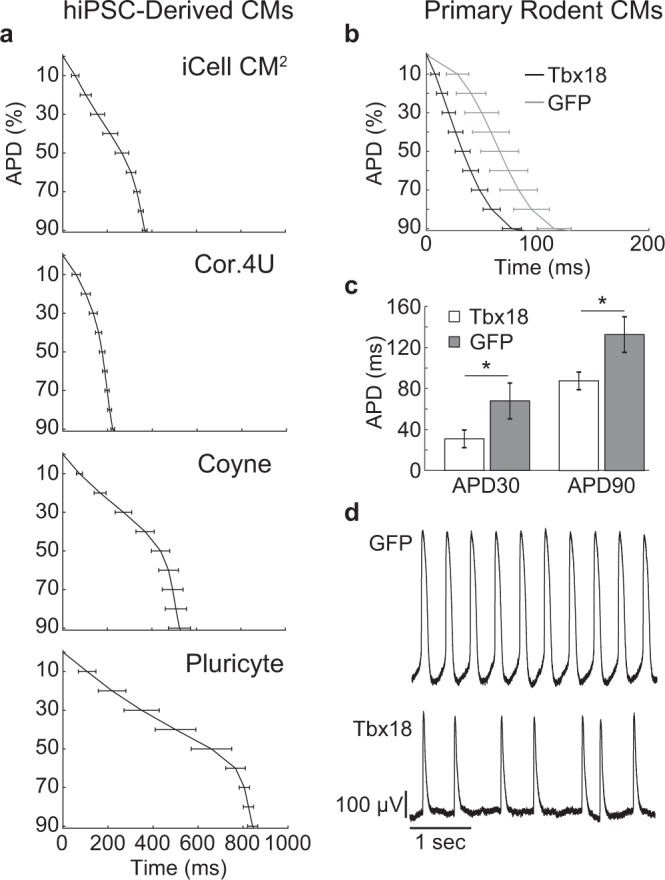
Figure 7.

LEAP morphology from hiPSC-derived and primary rodent cardiomyocytes. (a) LEAP repolarization timing is shown for four sources of hiPSC-derived cardiomyocytes. Repolarization is represented as the mean ± standard deviation of APD across wells for APD0 to APD90 (iCell CM2 n = 20 wells, Cor.4U n = 17 wells, Coyne n = 24 wells, Pluricyte n = 5 wells). (b) LEAP repolarization timing is shown for GFP-transfected (n = 17) and Tbx18-transfected (n = 8) primary neonatal rat ventricular cardiomyocytes. (c) Tbx18 transfection altered AP morphology by decreasing APD30 and APD90 relative to GFP-transfection (Mann Whitney U-Test, APD30 p < 0.001, APD90 p < 0.001). (d) GFP-transfected cardiomyocytes exhibited more regular beating than Tbx18 (GFP BP CoV = 8.47 ± 8.50, Tbx18 BP CoV = 39.39 ± 29.23, p < 0.001).
