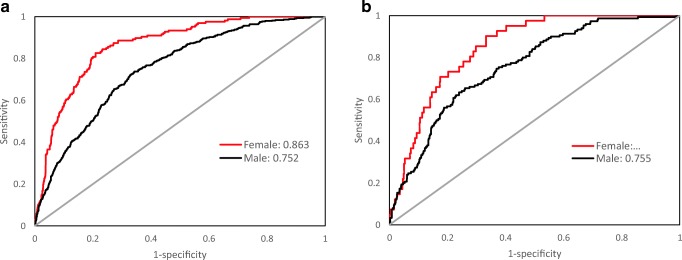
Fig. 3.
The ROC curves of the nomogram for 3-year T2DM risk in the training cohort (a) and validation cohort (b). *a In the training cohort, the AUCs of females and males were 0.863 (95% CI, 0.837–0.888) and 0.751 (95% CI, 0.729–0.774), respectively. b In the validation cohort, the AUCs of females and males were 0.847 (95% CI, 0.801–0.892) and 0.755 (95% CI, 0.717–0.794), respectively. ROC: receiver operating characteristics curves, AUC: area under curve. *Using bootstrap resampling (times = 500)

