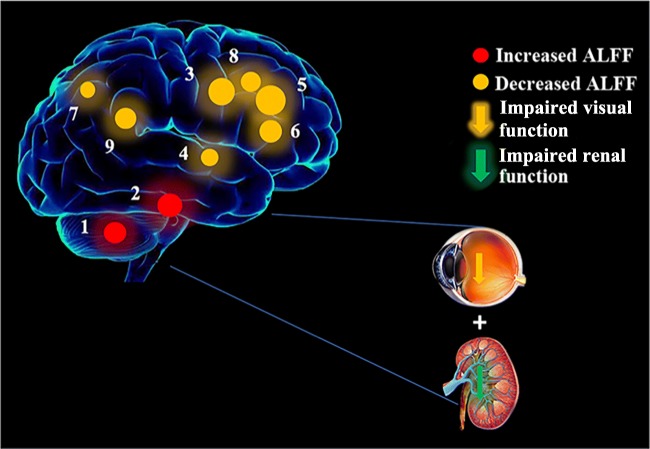
Fig. 5.
The ALFF results of brain activity in the DRN group. Compared with the HCs, the ALFF of the following regions were increased to various extents: 1-bilateral cerebellum posterior/anterior lobe (t = 6.0348), 2-left inferior temporal gyrus (t = 6.1407), and decreased ALFF values in the 3-bilateral medial frontal gyrus (t = − 6.2601), 4-right superior temporal gyrus (t = − 4.925), 5-right middle frontal gyrus (t = − 6.4547), 6-left middle/inferior frontal gyrus (t = − 5.6439), 7-bilateral precuneus (t = − 4.3607), 8-right middle frontal gyrus (t = − 5.2267), and 9-left inferior parietal lobule (t = − 5.4047). The sizes of the spots denote the degree of quantitative changes. HCs, healthy controls; ALFF, amplitude of low-frequency fluctuation; DRN, diabetic retinopathy and nephropathy

