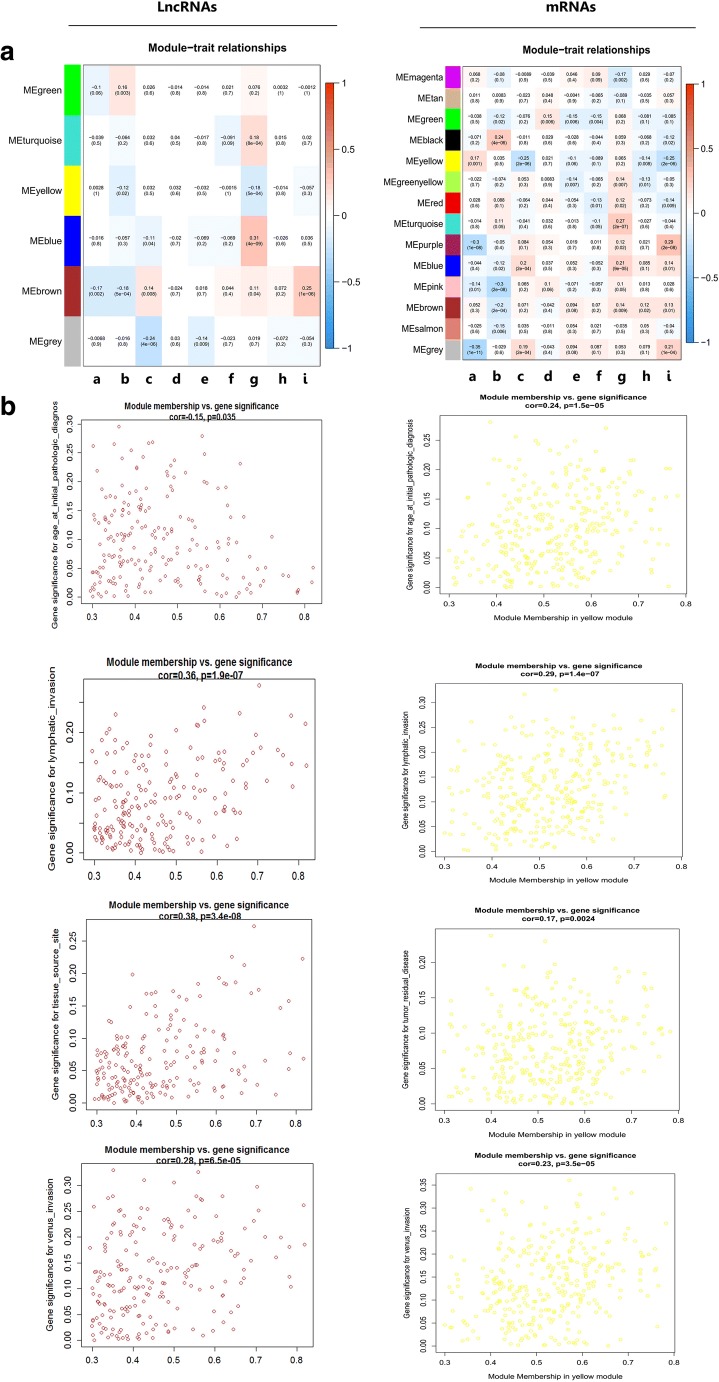
Fig. 3.
Analysis of module-trait relationships of ovarian cancer based on lncRNA data (left column) and mRNA data (right column). A Module-trait associations. Each row corresponds to a module eigengene, and column to a trait. a, age at initial pathologic diagnosis; b, Karnofsky performance score; c, lymphatic invasion; d, histologic grade; e, cancer status; f, clinical stage; g, tissue source site; h, tumor residual disease; i, vascular invasion. B The scatterplot of gene significance (GS) vs. module membership (MM) in the lncRNA-based brown co-expression module, or in the mRNA-based yellow co-expression module

