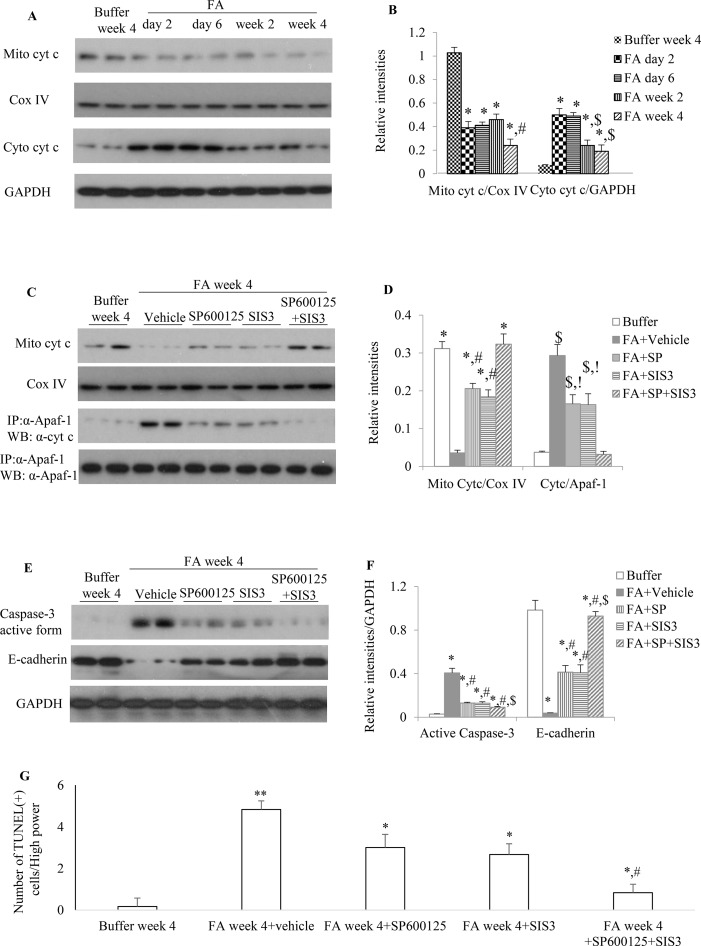
Figure 7.
The impact of blockade of JNK and/or Smad3 signaling on folic acid (FA)–induced kidney injury. (A and B) Western blotting shows mitochondrial cytochrome c and cytosol cytochrome c in buffer-treated or a time-course of FA-treated kidneys. (B) Quantification of Western blot results. *P < 0.05 vs. buffer week 4. # P < 0.05 vs. FA day 2, FA day 6, or FA week 2; $ P < 0.05 vs. FA day 2 or FA day 6. (C and D) Western blotting (WB, upper two panels) and immunoprecipitation/WB (IP/WB, lower two panels) show the effect of treatment with SP600125 alone, SIS3 alone, and SP600125 + SIS3 on mitochondrial cytochrome c and interaction of cytochrome c with Apaf-1 in 4-week FA-induced kidney injury. (D) Quantification of blots. *P < 0.05 vs. FA+vehicle; # P < 0.05 vs. FA+SP+SIS3; $ P < 0.05 vs. Buffer week4; !P < 0.05 vs. FA+SP+SIS3. (E and F) West blotting shows effect of treatment with SP600125 alone, SIS3 alone, and SP600125 + SIS3 on caspase-3 activation and E-cadherin in 4-week FA-induced kidney injury. (F) Quantification of blots. *P < 0.05 vs. buffer week 4. # P < 0.05 vs. FA + vehicle; $ P < 0.05 vs. FA+SP600125 or FA + SIS3. Data are mean ± SD. (G) Quantitation of TUNEL(+) cells per high power field (100×). *P < 0.05 vs. FA week 4; **P < 0.01 vs. buffer week 4; # P < 0.05 vs. FA week 4 + SP600125 or FA week 4 + SIS3. Data are mean ± SD (n = 6/group).

