Figure 9.
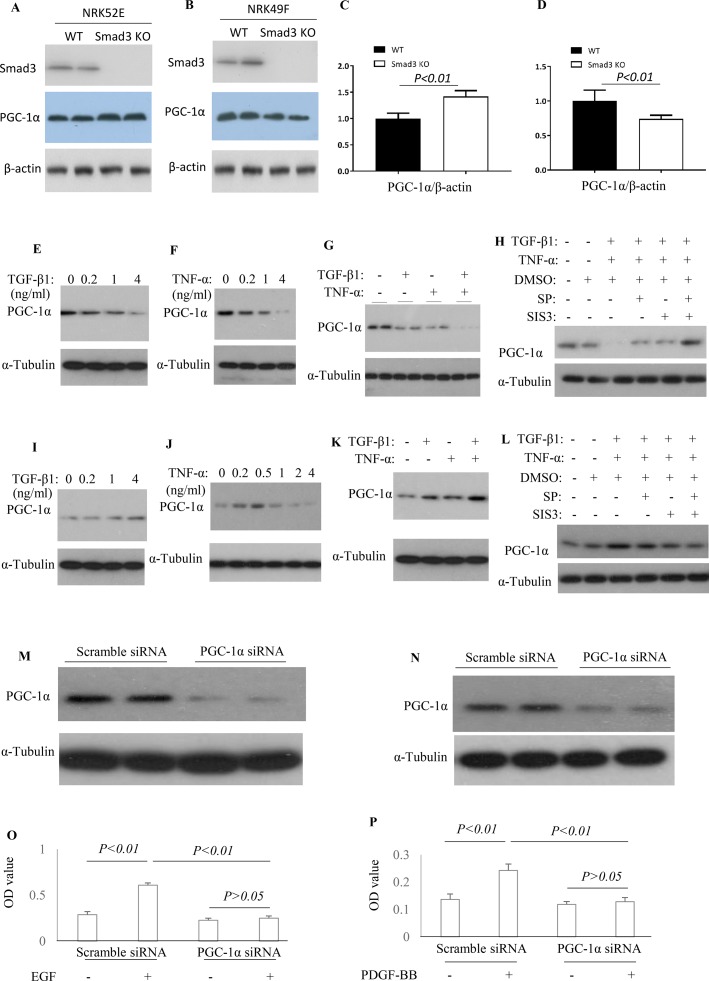
Differential effect of JNK and Smad3 inhibition on PGC-1α expression and proliferation in renal tubular epithelial cells versus fibroblasts. Western blotting demonstrated expression of Smad3, PGC-1α, and β-actin in wild type (WT) and Smad3 −/− NRK52E cells (A) and NRK49F cells (B). Quantification of PGC-1α/β-actin in NRK52E cells (C) and NRK49F cells (D). Western blotting identifies PGC-1α expression levels in NRK52E tubular epithelial cells (E–H) and NRK49F fibroblasts (I–L) after TGF-β1 and/or TNF-α treatment, with or without addition of SP600125 (SP) and/or SIS3. Experiments were repeated three times. Western blotting demonstrates a marked knock-down of PGC-1α by siRNA treatment in both NRK52E tubular epithelial cells (M), and NRK49F fibroblasts (N). Quantification of EGF-induced proliferation of NRK52E cells (O) and of PDGF-BB induced proliferation of NRK49F cells (P), following scramble or PGC-1α siRNA treatment. Data are mean ± SD. Experiments were repeated three times.

