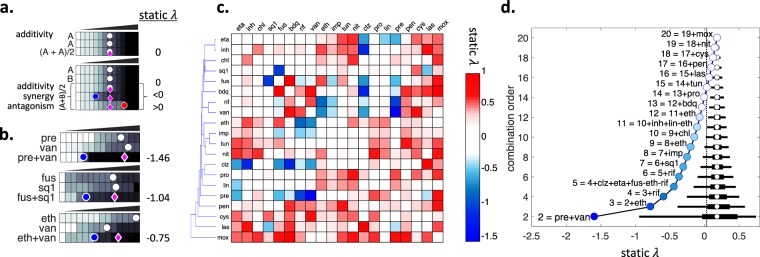
Figure 1.
Static interactions among 20 antibiotics against M. tuberculosis. (a) Experimental setup for pairwise drug interaction measurements. M. tuberculosis cells are grown on increasing concentrations of single drugs and drug combinations. In each row, a circle marks the dose where a given inhibition level is observed (e.g. IC70 = 70% Inhibitory Concentration). The magenta diamonds indicate the well that is expected to achieve IC70 given the single drug IC70s. We scored each pairwise combination by static λ = log2(obs/exp). (top) By definition, a drug’s combination with itself is additive. In this case, the observed and expected IC70s will be identical and static λ = 0. (bottom) When two different drugs are combined, if observed IC70 is less or more than expected IC70, static λ scores are negative or positive, indicating synergy or antagonism. (b) Three examples of synergy observed among 190 tested pairwise interactions. The observed IC70 in the combinations pre + van, fus + sq1 and eth + van (blue circles) is strikingly less than the expected IC70 given single drug IC70s (magenta diamonds), resulting in negative static λ scores. (c) Hierarchical clustering of all interaction scores among 20 antibiotics are shown as a heatmap. Blue, white or red indicate synergy, additivity or antagonism, respectively. Among 190 pairs tested, 11 pairs had static λ < −0.5. (d) The effect of combination order (number of drugs in a combination) on the distribution of static interaction scores (static λ). Black horizontal line indicates the 95% and 50% percentiles for the interaction scores, and white circle shows the mean of all interaction scores. The best combination in each combination order is indicated with a circle on the left, named in reference to the best combination in the previous order. Vertical dashed line marks the static λ value estimated for the 3-order combination eth + inh + rif, the current Mtb treatment.

