Figure 3.
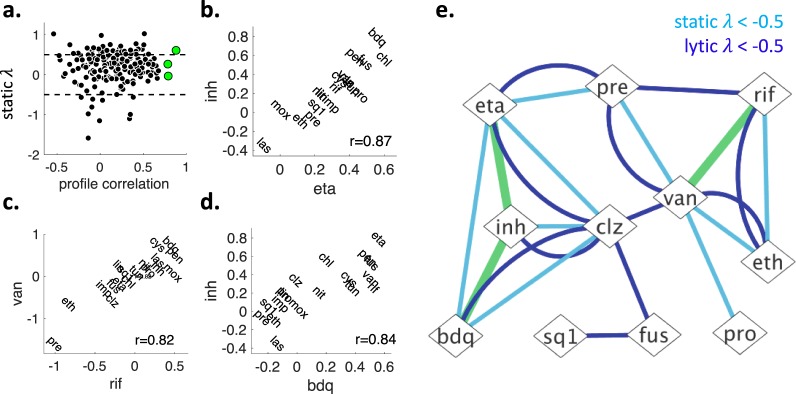
Finding drug pairs with similar drug interaction profiles and snapshot summary of pairwise static-lytic synergies and profile-similarity. (a) X-axis shows the static λ score profile correlations for drug pairs. Profile correlation is high for two drugs with similar drug interaction profiles. Y-axis shows the static λ for two drugs, which is negative, zero, or positive for synergistic, additive and antagonistic drug pairs, respectively. Each black circle indicates one pairwise drug combination. Three red circles show three drug pairs whose profiles were significantly correlated after Bonferroni correction (p < 2.6 × 10⁻⁴). Profile similarity of these pairs are visualized in (b–d), with the corresponding Spearman correlation scores. We define these pairs as “similar drugs”. (e) After the analysis of 190 pairs involving 20 drugs, we found 11 pairs with static synergy (static λ < −0.5, light blue edges), 9 pairs with lytic synergy (lytic λ < −0.5, dark blue edges) and three similar drug pairs (green edges).

