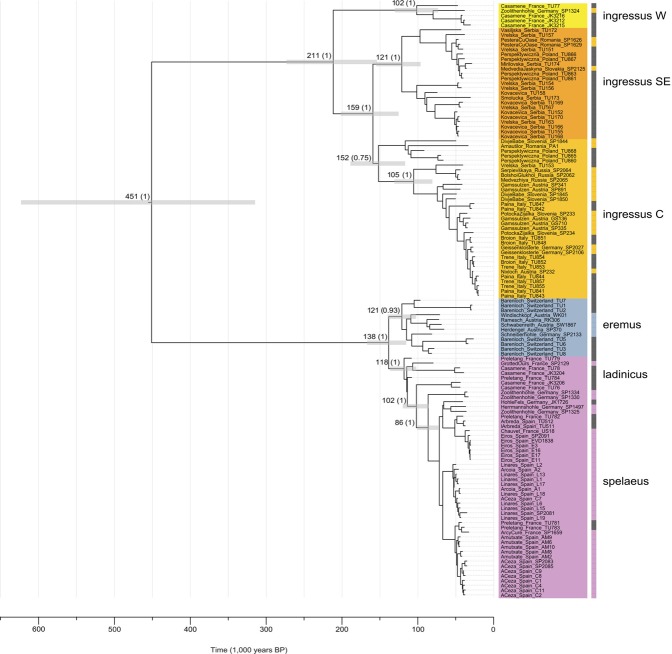
Figure 2.
Maximum Clade Credibility (MCC) phylogeny of 123 mitochondrial genomes. MCC phylogeny resulting from a BEAST analysis of 64 previously published and 59 mitochondrial genomes reported here drawn to a timescale. The relaxed molecular clock was calibrated using the tip-dating method. Nodes leading to major clades are labelled with the inferred tMRCA (95% highest posterior density of node ages is shown by grey bars). Posterior probabilities from 200,000,000 steps are provided in parentheses along branches leading to major clades. For visibility reasons, only support values related to the relationship of the major clades are shown. Haplogroup clades19 are indicated by the colour coding matching Fig. 1. Haplogroup identifications19 based on previous mtDNA40,41 analyses are provided as rectangular bars to the right of sample names. Trees were visualised using Figtree 1.4.3 (tree.bio.ed.ac.uk/software/figtree/).

