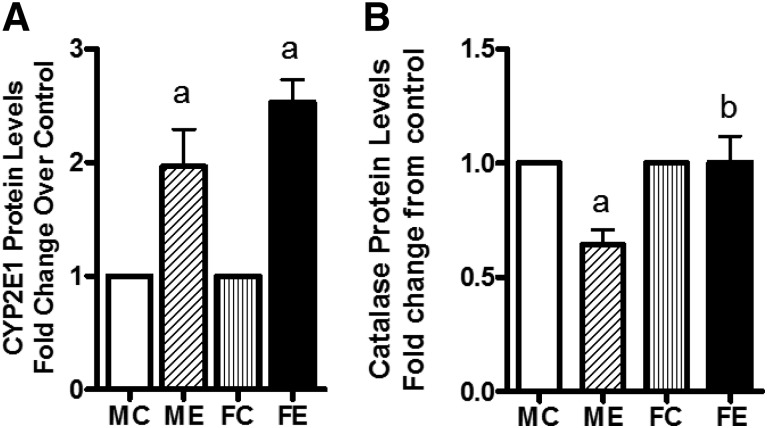
Fig. 2.
Levels of CYP2E1 (A) and catalase (B). After binge treatments (as in Fig. 1), the whole-cell extracts were prepared (see Materials and Methods). The protein levels of these components were determined by Western blotting. Fold change over respective male or female control values are presented as mean ± S.E.M. (n = 4 rats). a, Significant compared with control (P < 0.05); b, significant compared with the male ethanol binge group; (P < 0.05). FC, female control; FE, female ethanol binge; MC, male control; ME, male ethanol binge.

