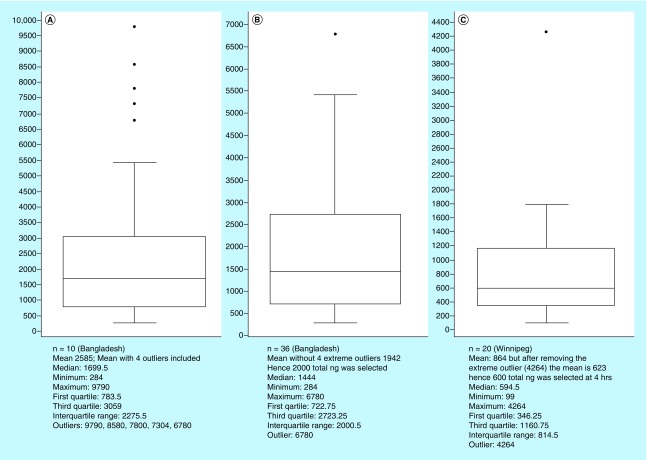
Figure 1. . Box plot statistical data for total acetylamantadine amount in healthy volunteers at study sites.
Data are presented for Bangladesh (A & B) and Winnipeg (C) healthy groups. Box plots were constructed to ascertain cutoff points in ostensibly normal individual’s for determination of ‘outliers’ according to the amantadine test.

